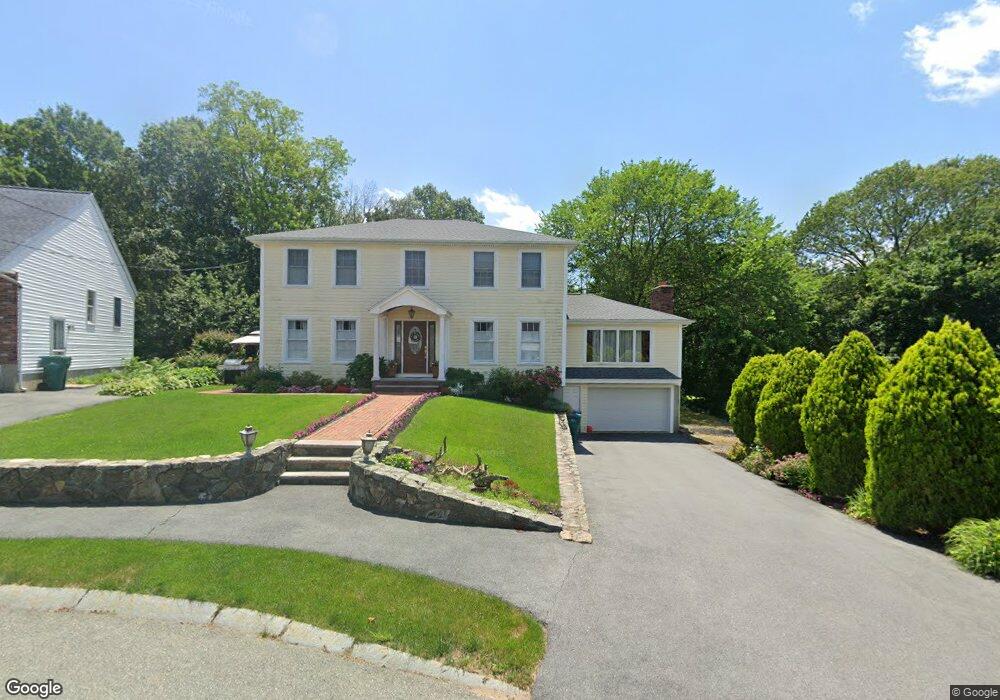
31 Scranton Way Lynn, MA 01904
Fays Estate NeighborhoodEstimated Value: $848,000 - $885,673
4
Beds
3
Baths
2,676
Sq Ft
$322/Sq Ft
Est. Value
About This Home
This home is located at 31 Scranton Way, Lynn, MA 01904 and is currently estimated at $861,168, approximately $321 per square foot. 31 Scranton Way is a home located in Essex County with nearby schools including Aborn Elementary School, William R. Fallon School, and Pickering Middle School.
Ownership History
Date
Name
Owned For
Owner Type
Purchase Details
Closed on
Aug 5, 1998
Sold by
Melanson Brian R
Bought by
Fennell Robert F
Current Estimated Value
Home Financials for this Owner
Home Financials are based on the most recent Mortgage that was taken out on this home.
Original Mortgage
$184,000
Outstanding Balance
$38,386
Interest Rate
6.92%
Mortgage Type
Purchase Money Mortgage
Estimated Equity
$822,782
Create a Home Valuation Report for This Property
The Home Valuation Report is an in-depth analysis detailing your home's value as well as a comparison with similar homes in the area
Home Values in the Area
Average Home Value in this Area
Purchase History
| Date | Buyer | Sale Price | Title Company |
|---|---|---|---|
| Fennell Robert F | $230,000 | -- | |
| Fennell Robert F | $230,000 | -- |
Source: Public Records
Mortgage History
| Date | Status | Borrower | Loan Amount |
|---|---|---|---|
| Open | Fennell Robert F | $50,000 | |
| Open | Fennell Robert F | $184,000 | |
| Closed | Fennell Robert F | $184,000 |
Source: Public Records
Tax History Compared to Growth
Tax History
| Year | Tax Paid | Tax Assessment Tax Assessment Total Assessment is a certain percentage of the fair market value that is determined by local assessors to be the total taxable value of land and additions on the property. | Land | Improvement |
|---|---|---|---|---|
| 2025 | $8,852 | $854,400 | $230,800 | $623,600 |
| 2024 | $8,570 | $813,900 | $221,300 | $592,600 |
| 2023 | $8,192 | $734,700 | $210,300 | $524,400 |
| 2022 | $8,211 | $660,600 | $176,600 | $484,000 |
| 2021 | $7,664 | $588,200 | $160,500 | $427,700 |
| 2020 | $7,701 | $574,700 | $164,100 | $410,600 |
| 2019 | $7,726 | $540,300 | $156,600 | $383,700 |
| 2018 | $7,440 | $491,100 | $153,100 | $338,000 |
| 2017 | $6,895 | $442,000 | $136,600 | $305,400 |
| 2016 | $6,567 | $405,900 | $117,900 | $288,000 |
| 2015 | $6,342 | $378,600 | $116,400 | $262,200 |
Source: Public Records
Map
Nearby Homes