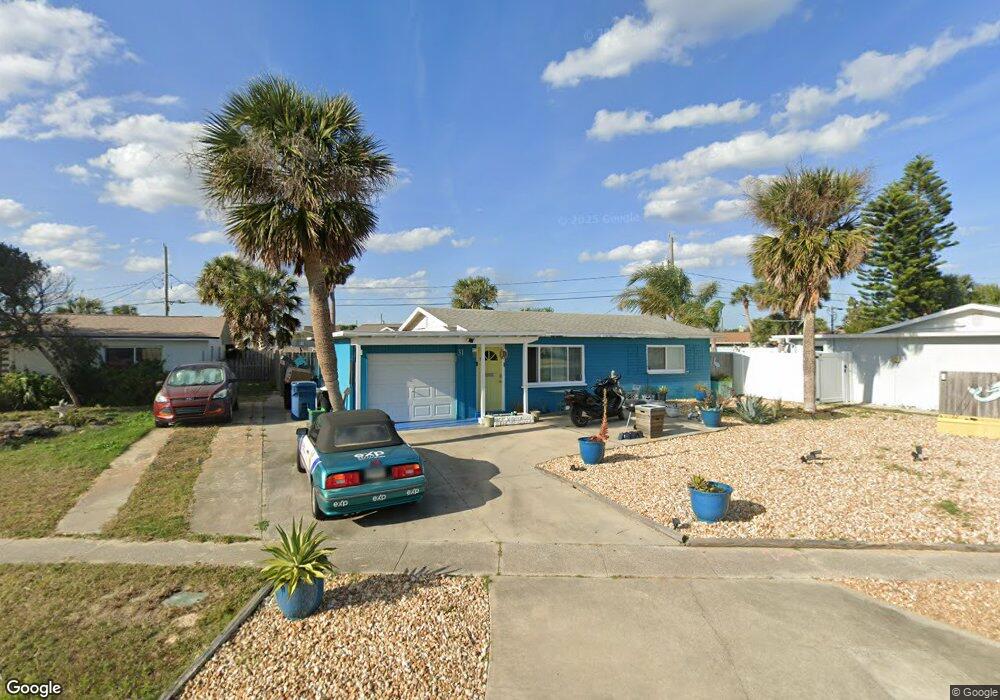
31 Seabreeze Dr Ormond Beach, FL 32176
Estimated Value: $244,000 - $282,000
2
Beds
1
Bath
918
Sq Ft
$282/Sq Ft
Est. Value
About This Home
This home is located at 31 Seabreeze Dr, Ormond Beach, FL 32176 and is currently estimated at $259,032, approximately $282 per square foot. 31 Seabreeze Dr is a home located in Volusia County with nearby schools including Ormond Beach Middle School, Seabreeze High School, and St Brendan Catholic School.
Ownership History
Date
Name
Owned For
Owner Type
Purchase Details
Closed on
Jul 1, 2024
Sold by
Nevins Constance and Nevins Archie
Bought by
Mycan Llc
Current Estimated Value
Purchase Details
Closed on
Apr 13, 2017
Sold by
Nunziata John C and Nunziata Renee
Bought by
Nevins Constance and Nevins Archie
Home Financials for this Owner
Home Financials are based on the most recent Mortgage that was taken out on this home.
Original Mortgage
$126,000
Interest Rate
6%
Mortgage Type
Balloon
Purchase Details
Closed on
Dec 9, 2002
Sold by
Groves James John
Bought by
Nunziata John C and Nunziata Renee
Purchase Details
Closed on
Jun 5, 1997
Sold by
Groves James J and Groves Paula A
Bought by
Groves Rev Living Tr Agreement
Create a Home Valuation Report for This Property
The Home Valuation Report is an in-depth analysis detailing your home's value as well as a comparison with similar homes in the area
Home Values in the Area
Average Home Value in this Area
Purchase History
| Date | Buyer | Sale Price | Title Company |
|---|---|---|---|
| Mycan Llc | $150,000 | None Listed On Document | |
| Mycan Llc | $150,000 | None Listed On Document | |
| Nevins Constance | $151,000 | Fidelity National Title Of F | |
| Nunziata John C | $75,000 | -- | |
| Groves Rev Living Tr Agreement | -- | -- |
Source: Public Records
Mortgage History
| Date | Status | Borrower | Loan Amount |
|---|---|---|---|
| Previous Owner | Nevins Constance | $126,000 |
Source: Public Records
Tax History
| Year | Tax Paid | Tax Assessment Tax Assessment Total Assessment is a certain percentage of the fair market value that is determined by local assessors to be the total taxable value of land and additions on the property. | Land | Improvement |
|---|---|---|---|---|
| 2026 | $4,790 | $252,706 | $137,088 | $115,618 |
| 2025 | $4,790 | $252,875 | $137,088 | $115,787 |
| 2024 | $4,272 | $259,700 | $137,088 | $122,612 |
| 2023 | $4,272 | $253,102 | $137,088 | $116,014 |
| 2022 | $3,841 | $207,032 | $88,128 | $118,904 |
| 2021 | $3,620 | $167,505 | $70,400 | $97,105 |
| 2020 | $3,362 | $154,526 | $70,400 | $84,126 |
| 2019 | $3,392 | $153,532 | $70,400 | $83,132 |
| 2018 | $3,165 | $140,566 | $49,600 | $90,966 |
| 2017 | $2,785 | $121,573 | $46,400 | $75,173 |
| 2016 | $2,649 | $115,077 | $0 | $0 |
| 2015 | $2,542 | $108,898 | $0 | $0 |
| 2014 | $2,350 | $104,343 | $0 | $0 |
Source: Public Records
Map
Nearby Homes
- 142 Holland Rd
- 51 Rivocean Dr
- 15 Aqua Vista Dr
- 6 Eucalyptus Cir
- 1926 Ocean Shore Blvd Unit 3120
- 1926 Ocean Shore Blvd Unit 2080
- 1926 Ocean Shore Blvd Unit 109
- 56 Margaret Rd
- 82 Margaret Rd
- 59 Margaret Rd
- 21 Sunset Blvd
- 66 Ocean Shore Dr
- 4310 John Anderson Dr
- 29 Ocean Shore Dr
- 36 River Shore Dr
- 2100 Ocean Shore Blvd Unit 2090
- 2100 Ocean Shore Blvd Unit 209
- 15 Longfellow Cir
- 55 Seaside Dr
- 4 Ocean Shore Dr
- 33 Seabreeze Dr
- 29 Seabreeze Dr
- 28 Rivocean Dr
- 26 Rivocean Dr
- 27 Seabreeze Dr
- 35 Seabreeze Dr
- 30 Rivocean Dr
- 24 Rivocean Dr
- 32 Seabreeze Dr
- 30 Seabreeze Dr
- 34 Seabreeze Dr
- 25 Seabreeze Dr
- 37 Seabreeze Dr
- 41 Seabreeze Dr
- 28 Seabreeze Dr
- 32 Rivocean Dr
- 22 Rivocean Dr
- 36 Seabreeze Dr
- 26 Seabreeze Dr
- 34 Rivocean Dr
Your Personal Tour Guide
Ask me questions while you tour the home.