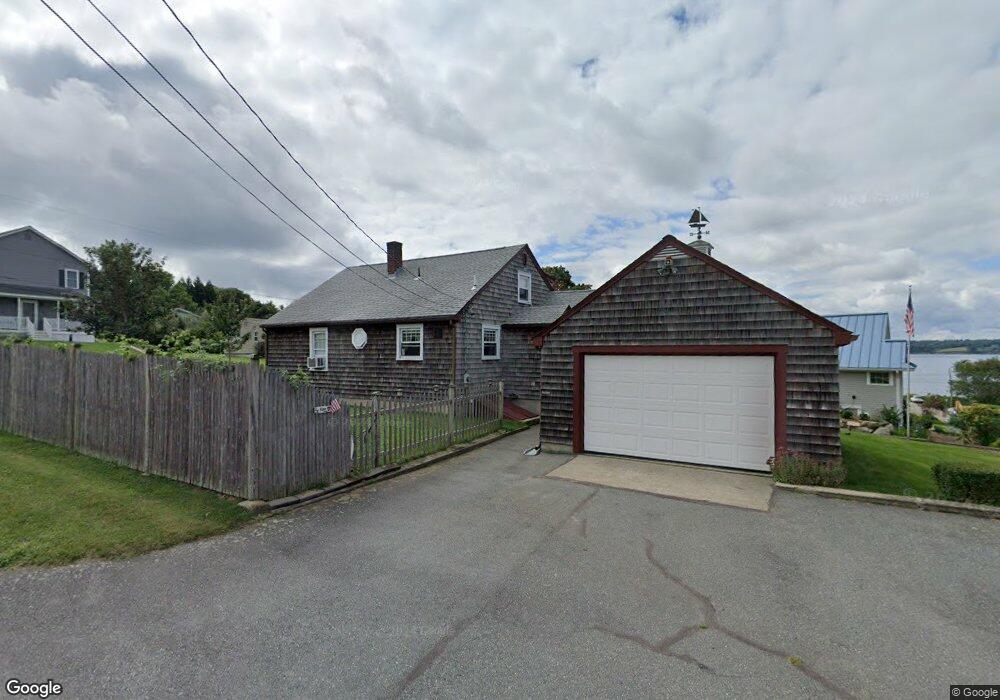
31 Seaspray Way Little Compton, RI 02837
Estimated Value: $626,609 - $966,000
4
Beds
3
Baths
1,608
Sq Ft
$528/Sq Ft
Est. Value
About This Home
This home is located at 31 Seaspray Way, Little Compton, RI 02837 and is currently estimated at $848,652, approximately $527 per square foot. 31 Seaspray Way is a home located in Newport County with nearby schools including Wilbur & McMahon School.
Ownership History
Date
Name
Owned For
Owner Type
Purchase Details
Closed on
Aug 15, 1994
Sold by
Ryan James F
Bought by
Medeiros Richard M and Medeiros Rachel
Current Estimated Value
Home Financials for this Owner
Home Financials are based on the most recent Mortgage that was taken out on this home.
Original Mortgage
$110,000
Interest Rate
8.52%
Mortgage Type
Purchase Money Mortgage
Create a Home Valuation Report for This Property
The Home Valuation Report is an in-depth analysis detailing your home's value as well as a comparison with similar homes in the area
Home Values in the Area
Average Home Value in this Area
Purchase History
| Date | Buyer | Sale Price | Title Company |
|---|---|---|---|
| Medeiros Richard M | $150,000 | -- | |
| Medeiros Richard M | $150,000 | -- |
Source: Public Records
Mortgage History
| Date | Status | Borrower | Loan Amount |
|---|---|---|---|
| Open | Medeiros Richard M | $50,000 | |
| Open | Medeiros Richard M | $100,000 | |
| Closed | Medeiros Richard M | $89,500 | |
| Closed | Medeiros Richard M | $110,000 |
Source: Public Records
Tax History Compared to Growth
Tax History
| Year | Tax Paid | Tax Assessment Tax Assessment Total Assessment is a certain percentage of the fair market value that is determined by local assessors to be the total taxable value of land and additions on the property. | Land | Improvement |
|---|---|---|---|---|
| 2025 | $2,258 | $471,500 | $183,200 | $288,300 |
| 2024 | $2,044 | $402,400 | $146,100 | $256,300 |
| 2023 | $1,996 | $402,400 | $146,100 | $256,300 |
| 2022 | $1,972 | $402,400 | $146,100 | $256,300 |
| 2021 | $2,096 | $347,100 | $173,200 | $173,900 |
| 2020 | $2,079 | $347,100 | $173,200 | $173,900 |
| 2019 | $2,058 | $347,100 | $173,200 | $173,900 |
| 2018 | $2,172 | $364,500 | $181,100 | $183,400 |
| 2016 | $2,067 | $364,500 | $181,100 | $183,400 |
| 2015 | $2,084 | $362,400 | $179,000 | $183,400 |
| 2014 | $2,044 | $362,400 | $179,000 | $183,400 |
Source: Public Records
Map
Nearby Homes