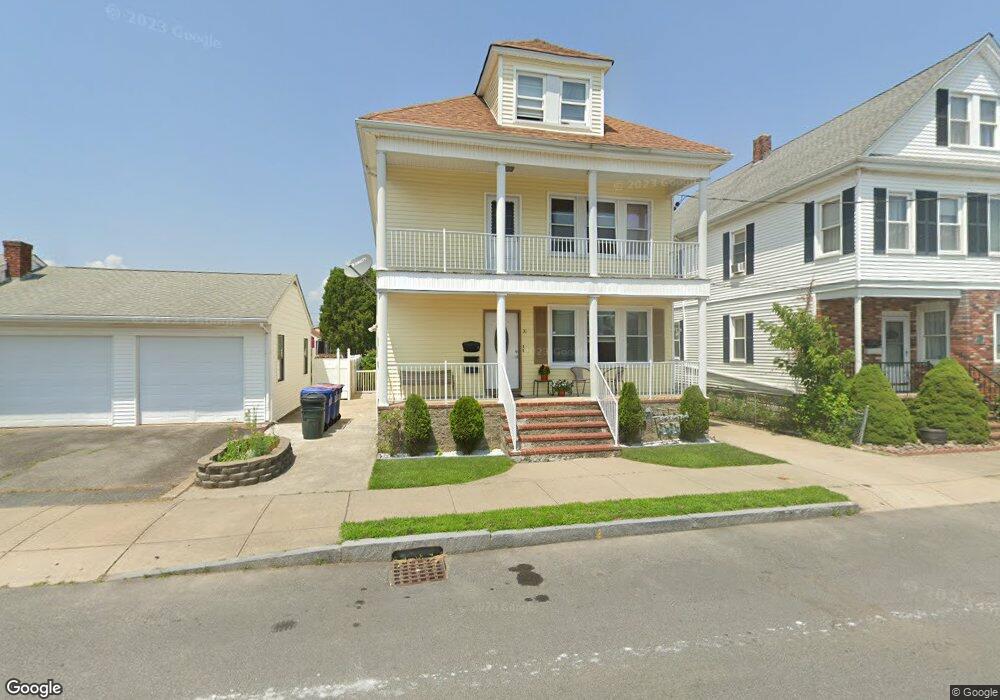
31 Sharp St New Bedford, MA 02740
The South End NeighborhoodEstimated Value: $448,000 - $641,000
6
Beds
2
Baths
2,534
Sq Ft
$206/Sq Ft
Est. Value
About This Home
This home is located at 31 Sharp St, New Bedford, MA 02740 and is currently estimated at $521,476, approximately $205 per square foot. 31 Sharp St is a home located in Bristol County with nearby schools including Betsey B. Winslow Elementary School, Keith Middle School, and New Bedford High School.
Ownership History
Date
Name
Owned For
Owner Type
Purchase Details
Closed on
May 29, 2024
Sold by
Deabreu Jorge M and Deabreu Maria
Bought by
Jorgimar Llc
Current Estimated Value
Purchase Details
Closed on
Jul 5, 2018
Sold by
Dosreis Manuel D and Deabreu Maria G
Bought by
Deabreu Maria and Deabreu Jorge M
Purchase Details
Closed on
Jul 25, 2013
Sold by
Deabreu Jorge M
Bought by
Dosreis Manuel D and Deabreu Maria G
Purchase Details
Closed on
Aug 28, 2000
Sold by
Sharp Street Nt
Bought by
Deabreu Jorge M and Dosreis Manuel E
Purchase Details
Closed on
May 30, 2000
Sold by
Household Finance Corp
Bought by
Sharp Street Nt
Purchase Details
Closed on
Oct 28, 1998
Sold by
Cabral Maryann
Bought by
Hfc
Create a Home Valuation Report for This Property
The Home Valuation Report is an in-depth analysis detailing your home's value as well as a comparison with similar homes in the area
Home Values in the Area
Average Home Value in this Area
Purchase History
| Date | Buyer | Sale Price | Title Company |
|---|---|---|---|
| Jorgimar Llc | -- | None Available | |
| Jorgimar Llc | -- | None Available | |
| Jorgimar Llc | -- | None Available | |
| Deabreu Maria | -- | -- | |
| Deabreu Maria | -- | -- | |
| Dosreis Manuel D | -- | -- | |
| Dosreis Manuel D | -- | -- | |
| Deabreu Jorge M | $120,000 | -- | |
| Deabreu Jorge M | $120,000 | -- | |
| Sharp Street Nt | $81,000 | -- | |
| Sharp Street Nt | $81,000 | -- | |
| Hfc | $83,000 | -- | |
| Hfc | $83,000 | -- |
Source: Public Records
Mortgage History
| Date | Status | Borrower | Loan Amount |
|---|---|---|---|
| Previous Owner | Hfc | $174,000 | |
| Previous Owner | Hfc | $110,000 |
Source: Public Records
Tax History
| Year | Tax Paid | Tax Assessment Tax Assessment Total Assessment is a certain percentage of the fair market value that is determined by local assessors to be the total taxable value of land and additions on the property. | Land | Improvement |
|---|---|---|---|---|
| 2025 | $5,494 | $485,800 | $96,600 | $389,200 |
| 2024 | $4,781 | $398,400 | $86,600 | $311,800 |
| 2023 | $4,647 | $325,200 | $74,700 | $250,500 |
| 2022 | $4,205 | $269,700 | $71,000 | $198,700 |
| 2021 | $4,205 | $269,700 | $71,000 | $198,700 |
| 2020 | $4,029 | $249,300 | $71,000 | $178,300 |
| 2019 | $3,923 | $238,200 | $71,000 | $167,200 |
| 2018 | $3,664 | $220,300 | $71,000 | $149,300 |
| 2017 | $3,288 | $197,000 | $71,000 | $126,000 |
| 2016 | $3,146 | $190,800 | $71,000 | $119,800 |
| 2015 | $2,938 | $186,800 | $71,000 | $115,800 |
| 2014 | $2,776 | $183,100 | $66,700 | $116,400 |
Source: Public Records
Map
Nearby Homes
- 32 Fulton St
- 126 Stackhouse St
- 28 Weaver St
- 230 Frank St
- 296 Hemlock St
- 111 Fruit St
- 35 Larch St
- 6 Walters Way
- 24 Potter St
- 511 Bedford St
- 136 Dartmouth St
- 12 Sears St
- 0 Victoria St Unit 73457953
- 199 Bonney St
- 311-313 Hawthorn St
- 273-275 Rivet St
- 265 Maple St
- 92 Rockland St
- 29 Elizabeth Ct
- 64 Katherine St
Your Personal Tour Guide
Ask me questions while you tour the home.