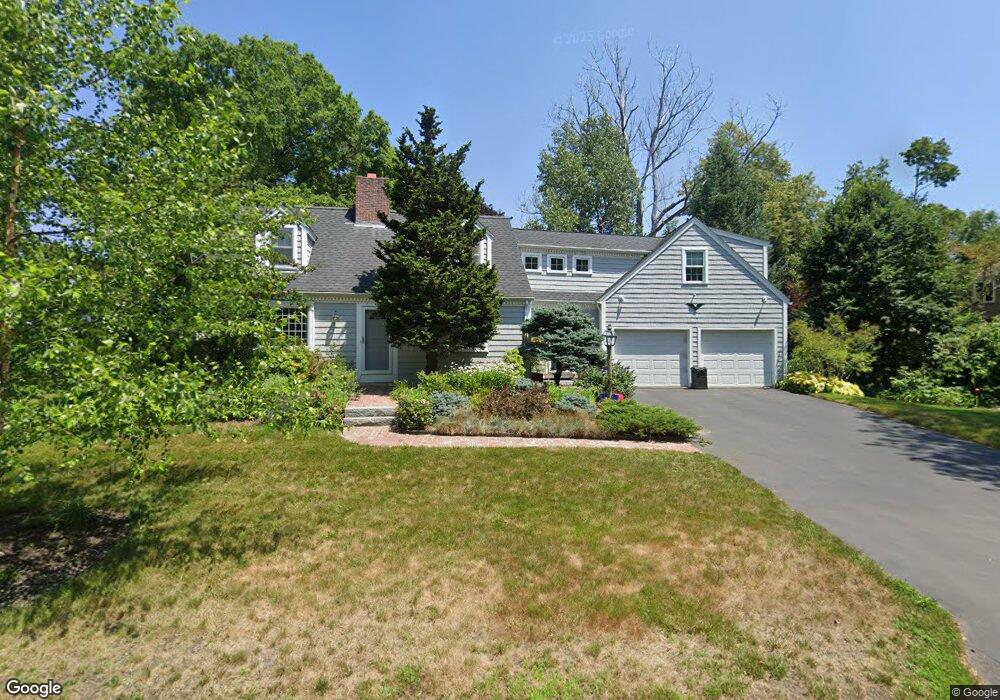
31 Shorewood Rd Marblehead, MA 01945
Estimated Value: $1,267,000 - $1,324,000
4
Beds
3
Baths
2,887
Sq Ft
$447/Sq Ft
Est. Value
About This Home
This home is located at 31 Shorewood Rd, Marblehead, MA 01945 and is currently estimated at $1,291,667, approximately $447 per square foot. 31 Shorewood Rd is a home located in Essex County with nearby schools including Marblehead High School, Marblehead Community Charter Public School, and Tower School.
Ownership History
Date
Name
Owned For
Owner Type
Purchase Details
Closed on
May 15, 2000
Sold by
Est Stoddard Warren J and Rubino Michael H
Bought by
Bushman Thomas W and Bushman Mary S
Current Estimated Value
Home Financials for this Owner
Home Financials are based on the most recent Mortgage that was taken out on this home.
Original Mortgage
$250,000
Interest Rate
8.21%
Mortgage Type
Purchase Money Mortgage
Create a Home Valuation Report for This Property
The Home Valuation Report is an in-depth analysis detailing your home's value as well as a comparison with similar homes in the area
Home Values in the Area
Average Home Value in this Area
Purchase History
| Date | Buyer | Sale Price | Title Company |
|---|---|---|---|
| Bushman Thomas W | $430,000 | -- |
Source: Public Records
Mortgage History
| Date | Status | Borrower | Loan Amount |
|---|---|---|---|
| Open | Bushman Thomas W | $245,000 | |
| Closed | Bushman Thomas W | $256,500 | |
| Closed | Bushman Thomas W | $250,000 |
Source: Public Records
Tax History Compared to Growth
Tax History
| Year | Tax Paid | Tax Assessment Tax Assessment Total Assessment is a certain percentage of the fair market value that is determined by local assessors to be the total taxable value of land and additions on the property. | Land | Improvement |
|---|---|---|---|---|
| 2025 | $11,405 | $1,260,200 | $703,000 | $557,200 |
| 2024 | $10,030 | $1,119,400 | $747,800 | $371,600 |
| 2023 | $10,643 | $1,064,300 | $658,100 | $406,200 |
| 2022 | $10,218 | $971,300 | $568,400 | $402,900 |
| 2021 | $9,653 | $926,400 | $523,500 | $402,900 |
| 2020 | $9,033 | $869,400 | $523,500 | $345,900 |
| 2019 | $8,980 | $836,100 | $493,600 | $342,500 |
| 2018 | $8,719 | $791,200 | $448,700 | $342,500 |
| 2017 | $8,546 | $776,200 | $433,700 | $342,500 |
| 2016 | $8,450 | $761,300 | $418,800 | $342,500 |
| 2015 | $7,713 | $696,100 | $373,900 | $322,200 |
| 2014 | $7,558 | $681,500 | $359,000 | $322,500 |
Source: Public Records
Map
Nearby Homes
- 70 Maverick St
- 3 Oak St
- 6 Higgins Rd
- 100 Village St
- 282 Pleasant St
- 155 Village St
- 197A W Shore Dr Unit A
- 24 Maple St
- 24-26 Knight Ave
- 5 Riverbank Rd
- 436 Lafayette St
- 29 Village St Unit 1
- 139 Jersey St
- 62 Longview Dr
- 66 Jersey St
- 41 Rowland St
- 10 Shepard St
- 4 Cross St Unit 1
- 43 Ocean Ave
- 148-150 Pleasant St Unit 2