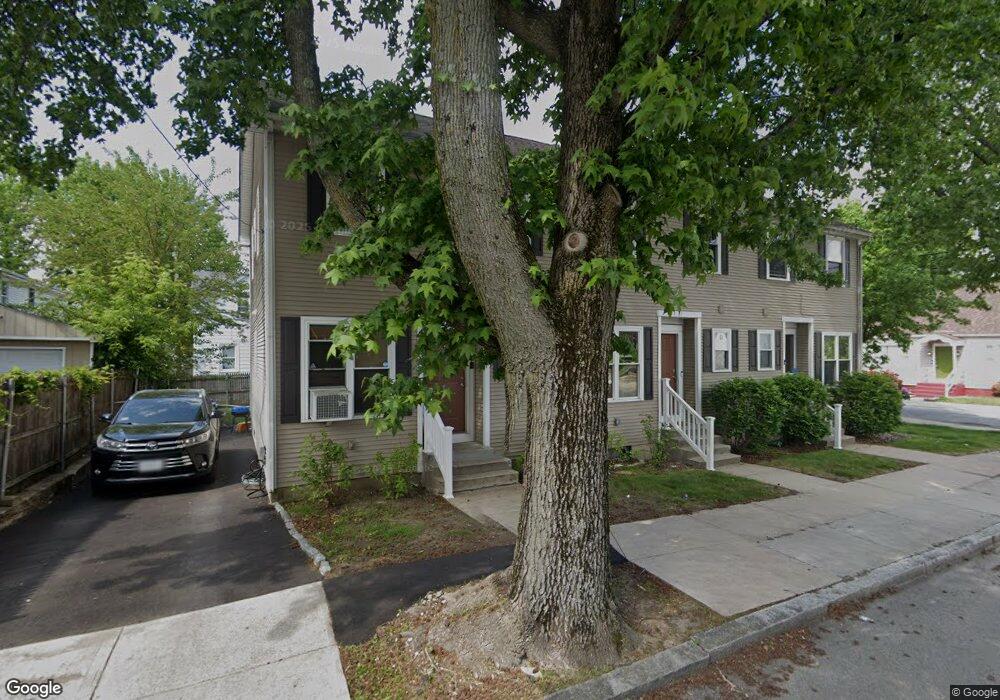
31 Sophia St Unit 2 Providence, RI 02909
Silver Lake NeighborhoodEstimated Value: $264,000 - $353,000
3
Beds
2
Baths
2,232
Sq Ft
$138/Sq Ft
Est. Value
About This Home
This home is located at 31 Sophia St Unit 2, Providence, RI 02909 and is currently estimated at $308,384, approximately $138 per square foot. 31 Sophia St Unit 2 is a home located in Providence County with nearby schools including Charles N. Fortes Elementary School, Asa Messer Elementary School, and Laurel Hill Annex School.
Ownership History
Date
Name
Owned For
Owner Type
Purchase Details
Closed on
Aug 1, 2019
Sold by
2639 Capital Inv Llc
Bought by
Westcott Realty
Current Estimated Value
Purchase Details
Closed on
Oct 4, 2018
Sold by
Milton Rashad
Bought by
2639 Capital 4 Llc
Purchase Details
Closed on
Sep 25, 2015
Sold by
Greene Stephen M
Bought by
Milton Rashad
Purchase Details
Closed on
Sep 21, 2015
Sold by
Title Investment Co 2
Bought by
Milton Rashad and Maldonaldo Magdelyn
Purchase Details
Closed on
Jun 24, 2014
Sold by
Manda Panda Partners
Bought by
Milton Rashad
Purchase Details
Closed on
Jun 14, 2006
Sold by
Balletto Gary
Bought by
Milton Rashad and Maldonodo Magdelyn
Home Financials for this Owner
Home Financials are based on the most recent Mortgage that was taken out on this home.
Original Mortgage
$195,500
Interest Rate
6.62%
Mortgage Type
Purchase Money Mortgage
Create a Home Valuation Report for This Property
The Home Valuation Report is an in-depth analysis detailing your home's value as well as a comparison with similar homes in the area
Home Values in the Area
Average Home Value in this Area
Purchase History
| Date | Buyer | Sale Price | Title Company |
|---|---|---|---|
| Westcott Realty | -- | -- | |
| 2639 Capital 4 Llc | $86,000 | -- | |
| Milton Rashad | $5,174 | -- | |
| Milton Rashad | -- | -- | |
| Milton Rashad | $5,920 | -- | |
| Milton Rashad | $230,000 | -- |
Source: Public Records
Mortgage History
| Date | Status | Borrower | Loan Amount |
|---|---|---|---|
| Previous Owner | Milton Rashad | $195,500 |
Source: Public Records
Tax History Compared to Growth
Tax History
| Year | Tax Paid | Tax Assessment Tax Assessment Total Assessment is a certain percentage of the fair market value that is determined by local assessors to be the total taxable value of land and additions on the property. | Land | Improvement |
|---|---|---|---|---|
| 2025 | $3,924 | $268,800 | $0 | $268,800 |
| 2024 | $3,459 | $188,500 | $0 | $188,500 |
| 2023 | $3,459 | $188,500 | $0 | $188,500 |
| 2022 | $3,355 | $188,500 | $0 | $188,500 |
| 2021 | $2,952 | $120,200 | $0 | $120,200 |
| 2020 | $2,952 | $120,200 | $0 | $120,200 |
| 2019 | $2,952 | $120,200 | $0 | $120,200 |
| 2018 | $3,826 | $119,700 | $0 | $119,700 |
| 2017 | $3,826 | $119,700 | $0 | $119,700 |
| 2016 | $3,826 | $119,700 | $0 | $119,700 |
| 2015 | $3,793 | $114,600 | $0 | $114,600 |
| 2014 | $3,868 | $114,600 | $0 | $114,600 |
| 2013 | $3,868 | $114,600 | $0 | $114,600 |
Source: Public Records
Map
Nearby Homes
- 144 Daniel Ave
- 27 Moorefield St
- 36 Moorefield St Unit 38
- 20 Magdalene St
- 649 Union Ave
- 27 What Cheer Ave
- 663 Plainfield St
- 776 Plainfield St
- 75 Prudence Ave
- 161 Prudence Ave
- 26 Alto St
- 665 Plainfield St
- 41 Terrace Ave
- 355 Laurel Hill Ave
- 454 Union Ave
- 64 Ralph St
- 14 Shafter St
- 47 Alverson Ave
- 240 Eastwood Ave
- 32 Maplewood Ave