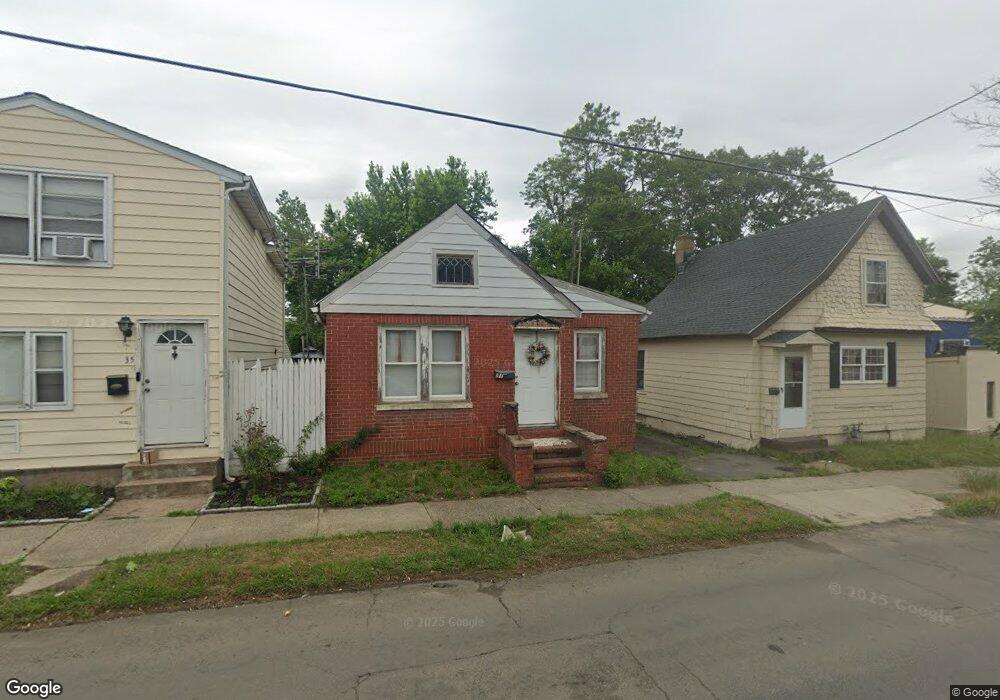
31 Spring St West Haven, CT 06516
Allingtown NeighborhoodEstimated Value: $189,000 - $253,000
2
Beds
1
Bath
680
Sq Ft
$335/Sq Ft
Est. Value
About This Home
This home is located at 31 Spring St, West Haven, CT 06516 and is currently estimated at $227,997, approximately $335 per square foot. 31 Spring St is a home located in New Haven County with nearby schools including Carrigan 5/6 Intermediate School, Harry M. Bailey Middle School, and West Haven High School.
Ownership History
Date
Name
Owned For
Owner Type
Purchase Details
Closed on
Jan 27, 2009
Sold by
Jp Morgan Chase Bank N
Bought by
Persaud Ameeta N
Current Estimated Value
Purchase Details
Closed on
Feb 24, 2004
Sold by
Yalartai Harmon D
Bought by
Yalartai Caleb and Yalartai Grace M
Home Financials for this Owner
Home Financials are based on the most recent Mortgage that was taken out on this home.
Original Mortgage
$57,500
Interest Rate
5.83%
Mortgage Type
Purchase Money Mortgage
Purchase Details
Closed on
Mar 4, 1996
Sold by
New Haven Savings Bank
Bought by
Yalartai Harmon D
Purchase Details
Closed on
Mar 17, 1987
Sold by
Diglio James V
Bought by
Cusanelli Mark P
Create a Home Valuation Report for This Property
The Home Valuation Report is an in-depth analysis detailing your home's value as well as a comparison with similar homes in the area
Home Values in the Area
Average Home Value in this Area
Purchase History
| Date | Buyer | Sale Price | Title Company |
|---|---|---|---|
| Persaud Ameeta N | $33,000 | -- | |
| Yalartai Caleb | $71,875 | -- | |
| Yalartai Harmon D | $11,500 | -- | |
| Persaud Ameeta N | $33,000 | -- | |
| Yalartai Caleb | $71,875 | -- | |
| Yalartai Harmon D | $11,500 | -- | |
| Cusanelli Mark P | $55,000 | -- |
Source: Public Records
Mortgage History
| Date | Status | Borrower | Loan Amount |
|---|---|---|---|
| Previous Owner | Cusanelli Mark P | $100,300 | |
| Previous Owner | Cusanelli Mark P | $57,500 |
Source: Public Records
Tax History
| Year | Tax Paid | Tax Assessment Tax Assessment Total Assessment is a certain percentage of the fair market value that is determined by local assessors to be the total taxable value of land and additions on the property. | Land | Improvement |
|---|---|---|---|---|
| 2025 | $3,800 | $110,040 | $44,380 | $65,660 |
| 2024 | $3,227 | $66,500 | $30,730 | $35,770 |
| 2023 | $3,093 | $66,500 | $30,730 | $35,770 |
| 2022 | $3,032 | $66,500 | $30,730 | $35,770 |
| 2021 | $3,032 | $66,500 | $30,730 | $35,770 |
| 2020 | $3,038 | $60,200 | $23,870 | $36,330 |
| 2019 | $2,930 | $60,200 | $23,870 | $36,330 |
| 2018 | $2,905 | $60,200 | $23,870 | $36,330 |
| 2017 | $2,749 | $60,200 | $23,870 | $36,330 |
| 2016 | $2,743 | $60,200 | $23,870 | $36,330 |
| 2015 | $2,822 | $69,930 | $29,050 | $40,880 |
| 2014 | $2,804 | $69,930 | $29,050 | $40,880 |
Source: Public Records
Map
Nearby Homes
Your Personal Tour Guide
Ask me questions while you tour the home.