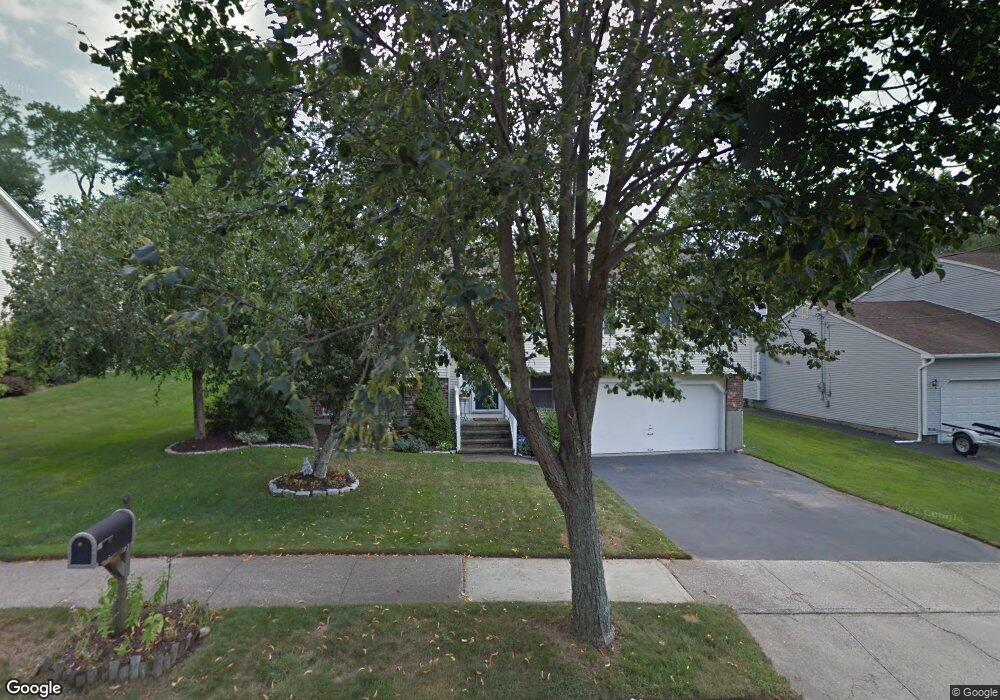
31 Spruce Peak Ln West Haven, CT 06516
West Shore NeighborhoodEstimated Value: $409,000 - $490,000
3
Beds
3
Baths
1,362
Sq Ft
$338/Sq Ft
Est. Value
About This Home
This home is located at 31 Spruce Peak Ln, West Haven, CT 06516 and is currently estimated at $460,121, approximately $337 per square foot. 31 Spruce Peak Ln is a home located in New Haven County with nearby schools including Carrigan 5/6 Intermediate School, Harry M. Bailey Middle School, and West Haven High School.
Ownership History
Date
Name
Owned For
Owner Type
Purchase Details
Closed on
Apr 2, 2018
Sold by
Cavaliere Louis G
Bought by
Solimene Richard P and Solimene Dina J
Current Estimated Value
Home Financials for this Owner
Home Financials are based on the most recent Mortgage that was taken out on this home.
Original Mortgage
$160,000
Outstanding Balance
$137,405
Interest Rate
4.38%
Mortgage Type
New Conventional
Estimated Equity
$322,716
Purchase Details
Closed on
Sep 10, 2001
Sold by
Cavalier Paul
Bought by
Cavalier Louis G and Cavalier Lorraine G
Purchase Details
Closed on
May 2, 1994
Sold by
Swaun Kathleen and Swaun Madeline H
Bought by
Cavalier Paul and Constantinople Robin
Purchase Details
Closed on
Oct 9, 1992
Sold by
Morgan Dev Corp
Bought by
Swaun Kathleen and Sullivan Madeline
Create a Home Valuation Report for This Property
The Home Valuation Report is an in-depth analysis detailing your home's value as well as a comparison with similar homes in the area
Home Values in the Area
Average Home Value in this Area
Purchase History
| Date | Buyer | Sale Price | Title Company |
|---|---|---|---|
| Solimene Richard P | $200,000 | -- | |
| Cavalier Louis G | $170,000 | -- | |
| Cavalier Paul | $172,000 | -- | |
| Swaun Kathleen | $170,000 | -- | |
| Solimene Richard P | $200,000 | -- | |
| Cavalier Louis G | $170,000 | -- | |
| Cavalier Paul | $172,000 | -- | |
| Swaun Kathleen | $170,000 | -- |
Source: Public Records
Mortgage History
| Date | Status | Borrower | Loan Amount |
|---|---|---|---|
| Open | Swaun Kathleen | $160,000 | |
| Closed | Swaun Kathleen | $160,000 |
Source: Public Records
Tax History Compared to Growth
Tax History
| Year | Tax Paid | Tax Assessment Tax Assessment Total Assessment is a certain percentage of the fair market value that is determined by local assessors to be the total taxable value of land and additions on the property. | Land | Improvement |
|---|---|---|---|---|
| 2025 | $9,629 | $292,950 | $87,220 | $205,730 |
| 2024 | $8,778 | $187,320 | $60,410 | $126,910 |
| 2023 | $8,448 | $187,320 | $60,410 | $126,910 |
| 2022 | $8,296 | $187,320 | $60,410 | $126,910 |
| 2021 | $8,296 | $187,320 | $60,410 | $126,910 |
| 2020 | $8,040 | $165,410 | $55,580 | $109,830 |
| 2019 | $7,784 | $165,410 | $55,580 | $109,830 |
| 2018 | $7,673 | $165,410 | $55,580 | $109,830 |
| 2017 | $7,467 | $165,410 | $55,580 | $109,830 |
| 2016 | $7,384 | $165,410 | $55,580 | $109,830 |
| 2015 | $7,518 | $188,510 | $59,710 | $128,800 |
| 2014 | $7,518 | $188,510 | $59,710 | $128,800 |
Source: Public Records
Map
Nearby Homes
- 27 Spruce Peak Ln
- 35 Spruce Peak Ln
- 101 Jessie Dr
- 107 Jessie Dr
- 23 Spruce Peak Ln
- 95 Jessie Dr
- 42 Spruce Peak Ln
- 1 Tyroll Ln
- 39 Spruce Peak Ln
- 111 Jessie Dr
- 19 Spruce Peak Ln
- 133 Kaye Rd
- 46 Spruce Peak Ln
- 5 Tyroll Ln
- 127 Kaye Rd
- 43 Spruce Peak Ln
- 110 Jessie Dr
- 15 Spruce Peak Ln
- 117 Jessie Dr
- 2 Tyroll Ln