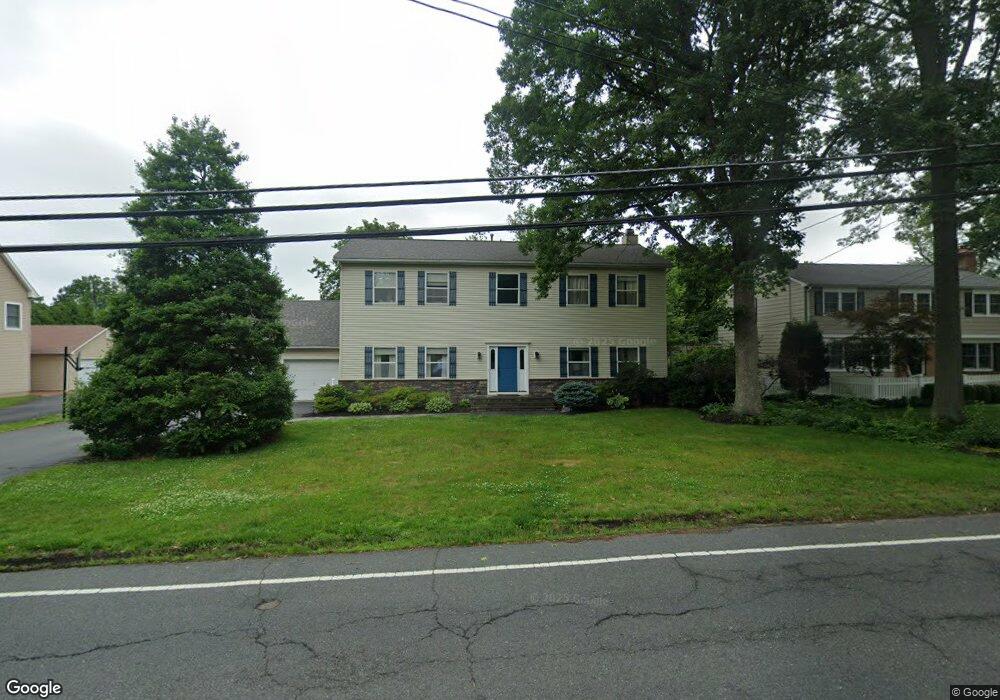
31 Station Rd Cranbury, NJ 08512
Estimated Value: $900,000 - $1,009,000
--
Bed
--
Bath
2,400
Sq Ft
$396/Sq Ft
Est. Value
About This Home
This home is located at 31 Station Rd, Cranbury, NJ 08512 and is currently estimated at $950,098, approximately $395 per square foot. 31 Station Rd is a home located in Middlesex County with nearby schools including The Cranbury School, SciCore Academy, and E Windsor Knowledge Beginnings.
Ownership History
Date
Name
Owned For
Owner Type
Purchase Details
Closed on
Dec 21, 2001
Sold by
Stehn Michael
Bought by
Pfeifer Matthew and Pfeifer Lynn
Current Estimated Value
Home Financials for this Owner
Home Financials are based on the most recent Mortgage that was taken out on this home.
Original Mortgage
$230,000
Interest Rate
6.84%
Purchase Details
Closed on
Dec 2, 1996
Sold by
Belcher David
Bought by
Stehn Michael and Stehn Phyllis
Home Financials for this Owner
Home Financials are based on the most recent Mortgage that was taken out on this home.
Original Mortgage
$205,000
Interest Rate
7.55%
Purchase Details
Closed on
Feb 24, 1995
Sold by
Tudor David
Bought by
Belcher David and Belcher Jeannien
Create a Home Valuation Report for This Property
The Home Valuation Report is an in-depth analysis detailing your home's value as well as a comparison with similar homes in the area
Home Values in the Area
Average Home Value in this Area
Purchase History
| Date | Buyer | Sale Price | Title Company |
|---|---|---|---|
| Pfeifer Matthew | $437,500 | -- | |
| Stehn Michael | $272,500 | -- | |
| Belcher David | $65,000 | -- |
Source: Public Records
Mortgage History
| Date | Status | Borrower | Loan Amount |
|---|---|---|---|
| Previous Owner | Pfeifer Matthew | $230,000 | |
| Previous Owner | Stehn Michael | $205,000 |
Source: Public Records
Tax History Compared to Growth
Tax History
| Year | Tax Paid | Tax Assessment Tax Assessment Total Assessment is a certain percentage of the fair market value that is determined by local assessors to be the total taxable value of land and additions on the property. | Land | Improvement |
|---|---|---|---|---|
| 2025 | $10,755 | $586,400 | $188,500 | $397,900 |
| 2024 | $10,602 | $586,400 | $188,500 | $397,900 |
| 2023 | $10,602 | $586,400 | $188,500 | $397,900 |
| 2022 | $10,450 | $586,400 | $188,500 | $397,900 |
| 2021 | $7,855 | $586,400 | $188,500 | $397,900 |
| 2020 | $10,438 | $586,400 | $188,500 | $397,900 |
| 2019 | $10,549 | $586,400 | $188,500 | $397,900 |
| 2018 | $11,546 | $586,400 | $188,500 | $397,900 |
| 2017 | $11,241 | $586,400 | $188,500 | $397,900 |
| 2016 | $11,335 | $586,400 | $188,500 | $397,900 |
| 2015 | $11,130 | $586,400 | $188,500 | $397,900 |
| 2014 | $11,171 | $586,400 | $188,500 | $397,900 |
Source: Public Records
Map
Nearby Homes