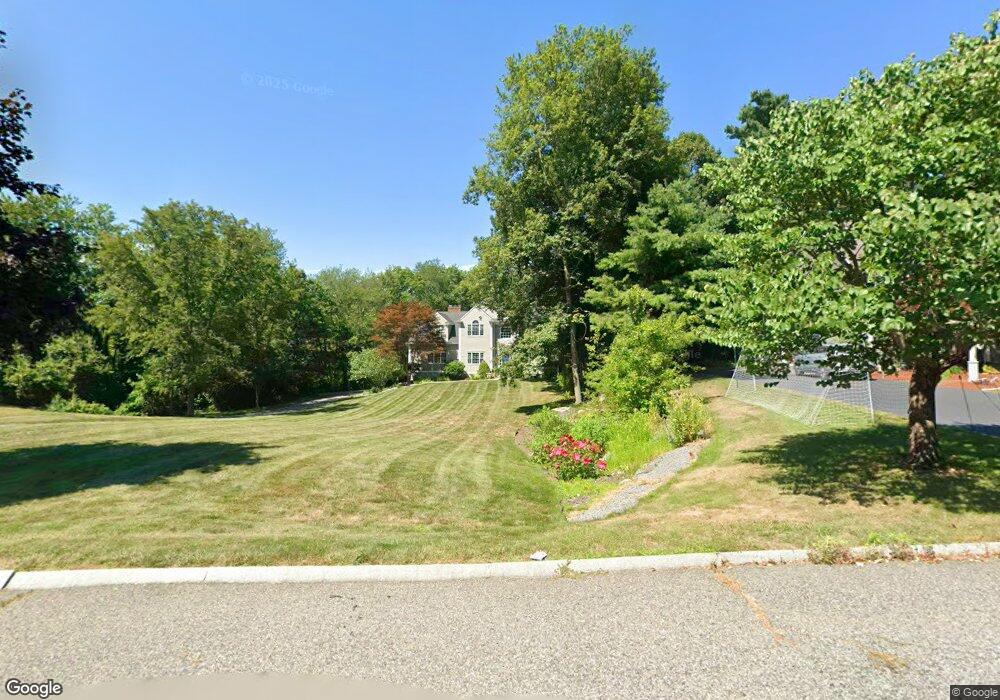
31 Stonefield Ct North Attleboro, MA 02760
Estimated Value: $928,029 - $1,211,000
4
Beds
3
Baths
3,222
Sq Ft
$321/Sq Ft
Est. Value
About This Home
This home is located at 31 Stonefield Ct, North Attleboro, MA 02760 and is currently estimated at $1,033,507, approximately $320 per square foot. 31 Stonefield Ct is a home located in Bristol County with nearby schools including North Attleboro High School, Cadence Academy Preschool - North Attleborough, and St John The Evangelist School.
Ownership History
Date
Name
Owned For
Owner Type
Purchase Details
Closed on
May 9, 2024
Sold by
Boyland Andrew J and Boyland Patricia Y
Bought by
Boyland Ft and Boyland
Current Estimated Value
Purchase Details
Closed on
Jan 14, 2000
Sold by
Corporate Constr Ltd
Bought by
Boyland Andrew J and Boyland Patricia Y
Home Financials for this Owner
Home Financials are based on the most recent Mortgage that was taken out on this home.
Original Mortgage
$350,000
Interest Rate
7.79%
Mortgage Type
Purchase Money Mortgage
Create a Home Valuation Report for This Property
The Home Valuation Report is an in-depth analysis detailing your home's value as well as a comparison with similar homes in the area
Home Values in the Area
Average Home Value in this Area
Purchase History
| Date | Buyer | Sale Price | Title Company |
|---|---|---|---|
| Boyland Ft | -- | None Available | |
| Boyland Ft | -- | None Available | |
| Boyland Andrew J | $487,000 | -- | |
| Boyland Andrew J | $487,000 | -- |
Source: Public Records
Mortgage History
| Date | Status | Borrower | Loan Amount |
|---|---|---|---|
| Previous Owner | Boyland Andrew J | $300,700 | |
| Previous Owner | Boyland Andrew J | $350,000 |
Source: Public Records
Tax History Compared to Growth
Tax History
| Year | Tax Paid | Tax Assessment Tax Assessment Total Assessment is a certain percentage of the fair market value that is determined by local assessors to be the total taxable value of land and additions on the property. | Land | Improvement |
|---|---|---|---|---|
| 2025 | $10,150 | $860,900 | $168,200 | $692,700 |
| 2024 | $10,125 | $877,400 | $168,200 | $709,200 |
| 2023 | $9,768 | $763,700 | $175,500 | $588,200 |
| 2022 | $9,020 | $647,500 | $168,200 | $479,300 |
| 2021 | $8,917 | $624,900 | $168,200 | $456,700 |
| 2020 | $8,779 | $611,800 | $168,200 | $443,600 |
| 2019 | $8,644 | $607,000 | $153,200 | $453,800 |
| 2018 | $7,739 | $580,100 | $153,200 | $426,900 |
| 2017 | $7,669 | $580,100 | $153,200 | $426,900 |
| 2016 | $7,385 | $558,600 | $177,600 | $381,000 |
| 2015 | $7,312 | $556,500 | $184,900 | $371,600 |
| 2014 | $7,267 | $548,900 | $186,600 | $362,300 |
Source: Public Records
Map
Nearby Homes