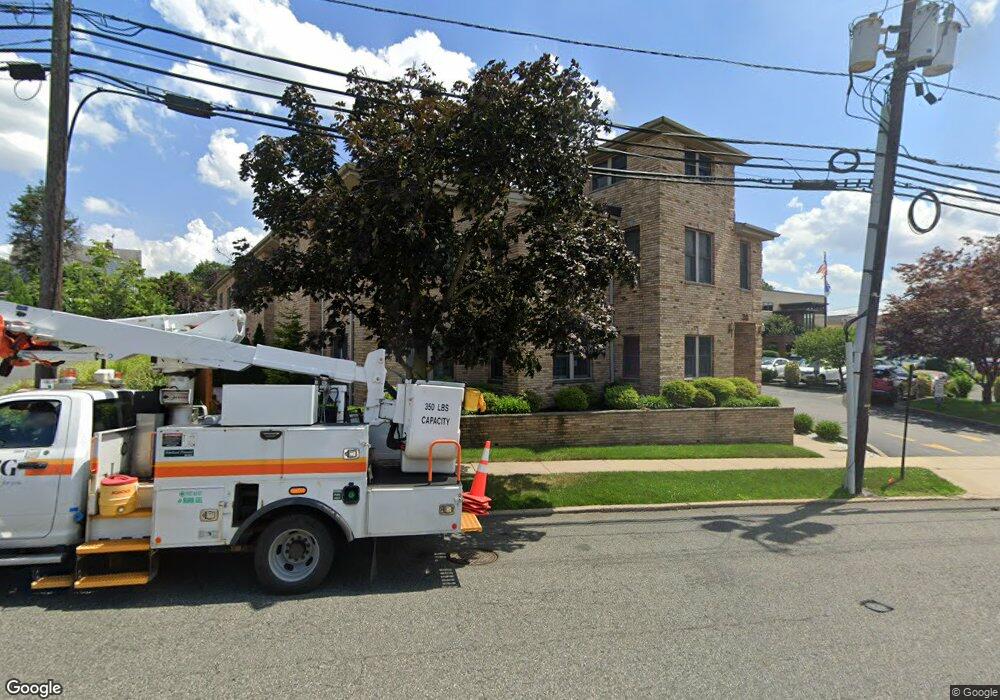
31 Stuyvesant Ave Lyndhurst, NJ 07071
Estimated Value: $297,000 - $443,936
--
Bed
--
Bath
914
Sq Ft
$407/Sq Ft
Est. Value
About This Home
This home is located at 31 Stuyvesant Ave, Lyndhurst, NJ 07071 and is currently estimated at $371,984, approximately $406 per square foot. 31 Stuyvesant Ave is a home located in Bergen County with nearby schools including Lyndhurst High School.
Ownership History
Date
Name
Owned For
Owner Type
Purchase Details
Closed on
Nov 20, 2014
Sold by
Jeannie Love Llc
Bought by
Dias Reiston
Current Estimated Value
Home Financials for this Owner
Home Financials are based on the most recent Mortgage that was taken out on this home.
Original Mortgage
$135,000
Outstanding Balance
$103,147
Interest Rate
3.93%
Mortgage Type
New Conventional
Estimated Equity
$268,837
Purchase Details
Closed on
May 23, 2006
Sold by
Padilla Jose E
Bought by
Crisafi Peter S and Crisafi Kristin M
Purchase Details
Closed on
Nov 17, 2005
Sold by
Radivojevic Dragana
Bought by
Metcalf Jean
Purchase Details
Closed on
Aug 28, 2001
Sold by
Troncone Palmina
Bought by
Fera Grace
Purchase Details
Closed on
Mar 26, 1999
Sold by
John Algonzzini and Algozzini Barbara
Bought by
Marrero Lou Ann
Purchase Details
Closed on
Jan 31, 1997
Sold by
Hanna Fakhry
Bought by
Fossetta Laurie A
Home Financials for this Owner
Home Financials are based on the most recent Mortgage that was taken out on this home.
Original Mortgage
$93,000
Interest Rate
7.65%
Create a Home Valuation Report for This Property
The Home Valuation Report is an in-depth analysis detailing your home's value as well as a comparison with similar homes in the area
Home Values in the Area
Average Home Value in this Area
Purchase History
| Date | Buyer | Sale Price | Title Company |
|---|---|---|---|
| Dias Reiston | $195,000 | Fidelity National Title | |
| Crisafi Peter S | $307,500 | -- | |
| Metcalf Jean | $311,000 | -- | |
| Fera Grace | -- | -- | |
| Marrero Lou Ann | $133,000 | -- | |
| Fossetta Laurie A | $123,600 | -- |
Source: Public Records
Mortgage History
| Date | Status | Borrower | Loan Amount |
|---|---|---|---|
| Open | Dias Reiston | $135,000 | |
| Previous Owner | Fossetta Laurie A | $93,000 |
Source: Public Records
Tax History Compared to Growth
Tax History
| Year | Tax Paid | Tax Assessment Tax Assessment Total Assessment is a certain percentage of the fair market value that is determined by local assessors to be the total taxable value of land and additions on the property. | Land | Improvement |
|---|---|---|---|---|
| 2025 | $6,604 | $319,900 | $185,000 | $134,900 |
| 2024 | $6,364 | $316,600 | $182,500 | $134,100 |
| 2023 | $7,105 | $313,200 | $180,000 | $133,200 |
| 2022 | $7,105 | $224,000 | $130,000 | $94,000 |
| 2021 | $6,557 | $224,000 | $130,000 | $94,000 |
| 2020 | $6,662 | $224,000 | $130,000 | $94,000 |
| 2019 | $6,612 | $224,000 | $130,000 | $94,000 |
| 2018 | $6,666 | $224,000 | $130,000 | $94,000 |
| 2017 | $6,498 | $224,000 | $130,000 | $94,000 |
| 2016 | $6,353 | $224,000 | $130,000 | $94,000 |
| 2015 | $6,153 | $224,000 | $130,000 | $94,000 |
| 2014 | $6,073 | $224,000 | $130,000 | $94,000 |
Source: Public Records
Map
Nearby Homes
- 54 Stuyvesant Ave
- 118 Rutherford Ave
- 59 Kearney St
- 65 E Gouverneur Ave
- 11 W Gouverneur Ave
- 419 Lake Ave
- 482 6th Ave
- 232 Stuyvesant Ave
- 252 Oriental Place
- 220 Webster Ave
- 334 Park Ave
- 237 Park Ave
- 271 Travers Place
- 30 W Pierrepont Ave
- 86 Wheaton Place
- 177 W Pierrepont Ave
- 15 E Pierrepont Ave
- 545 Lake Ave
- 325 Valley Brook Ave
- 31 Stuyvesant Ave
- 31 Stuyvesant Ave
- 31 Stuyvesant Ave
- 31 Stuyvesant Ave Unit 4D
- 31 Stuyvesant Ave Unit B
- 31 Stuyvesant Ave
- 31 Stuyvesant Ave
- 31 Stuyvesant Ave Unit 8H
- 31 Stuyvesant Ave Unit 1A
- 31 Stuyvesant Ave Unit 6F
- 31 Stuyvesant Ave Unit 7G
- 25 Stuyvesant Ave
- 35 Stuyvesant Ave
- 21 Stuyvesant Ave
- 33 Stuyvesant Ave
- 17 Stuyvesant Ave
- 39 Stuyvesant Ave
- 11 Stuyvesant Ave
- 18 Stuyvesant Ave
- 45-49 Stuyvesant Ave