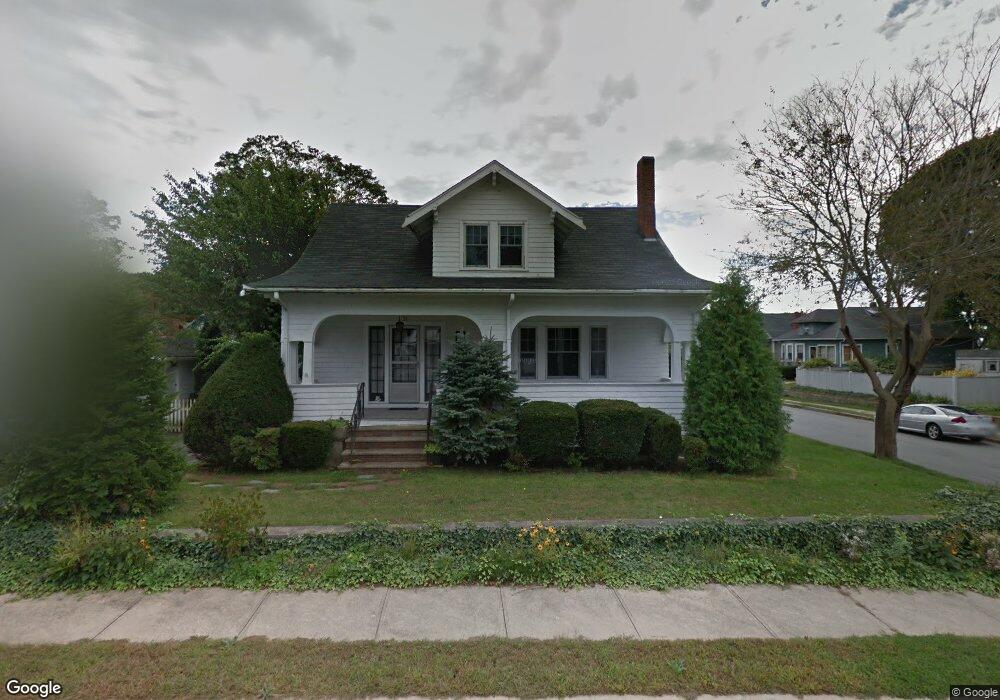
31 Taber St Fairhaven, MA 02719
Oxford NeighborhoodEstimated Value: $508,971 - $563,000
4
Beds
2
Baths
1,900
Sq Ft
$283/Sq Ft
Est. Value
About This Home
This home is located at 31 Taber St, Fairhaven, MA 02719 and is currently estimated at $536,993, approximately $282 per square foot. 31 Taber St is a home located in Bristol County with nearby schools including Fairhaven High School, Alma Del Mar Charter School, and City On A Hill Charter Public School New Bedford.
Ownership History
Date
Name
Owned For
Owner Type
Purchase Details
Closed on
Dec 3, 2020
Sold by
Genther James A
Bought by
James A Genther T
Current Estimated Value
Purchase Details
Closed on
Sep 18, 2019
Sold by
Demello Holly L
Bought by
Machado Holly L and Machado Nicholas D
Purchase Details
Closed on
Jul 1, 2011
Sold by
Genthner Floyd D
Bought by
Genthner James A
Create a Home Valuation Report for This Property
The Home Valuation Report is an in-depth analysis detailing your home's value as well as a comparison with similar homes in the area
Home Values in the Area
Average Home Value in this Area
Purchase History
| Date | Buyer | Sale Price | Title Company |
|---|---|---|---|
| James A Genther T | -- | None Available | |
| Machado Holly L | -- | -- | |
| Genthner James A | $60,000 | -- | |
| Genthner James A | $30,000 | -- |
Source: Public Records
Tax History
| Year | Tax Paid | Tax Assessment Tax Assessment Total Assessment is a certain percentage of the fair market value that is determined by local assessors to be the total taxable value of land and additions on the property. | Land | Improvement |
|---|---|---|---|---|
| 2025 | $38 | $410,700 | $172,100 | $238,600 |
| 2024 | $3,679 | $398,600 | $172,100 | $226,500 |
| 2023 | $3,603 | $362,100 | $150,800 | $211,300 |
| 2022 | $3,502 | $342,700 | $140,100 | $202,600 |
| 2021 | $3,337 | $295,600 | $126,800 | $168,800 |
| 2020 | $3,269 | $295,600 | $126,800 | $168,800 |
| 2019 | $3,042 | $260,700 | $105,100 | $155,600 |
| 2018 | $2,939 | $248,200 | $100,100 | $148,100 |
| 2017 | $2,878 | $239,000 | $100,100 | $138,900 |
| 2016 | $2,770 | $227,400 | $100,100 | $127,300 |
| 2015 | $2,734 | $225,000 | $100,100 | $124,900 |
Source: Public Records
Map
Nearby Homes
- 442 Dana Farms
- 14 Sycamore St
- 24 Academy Ave
- 313 Main St
- 253 Adams St
- 138 Main St Unit 13
- 10 Livesey Pkwy
- 71 Sycamore St
- 15 School St
- 16 Ash St
- 67 Bridge St
- 34 Washburn St Unit 36
- 24 Cotter St
- 39 Christian St
- 77 Adams St
- 8 Washington St
- 0 Nulands Neck Unit 73286360
- 1301 Pleasant St Unit 1305
- 239 Sawyer St
- 1441 Pleasant St
Your Personal Tour Guide
Ask me questions while you tour the home.