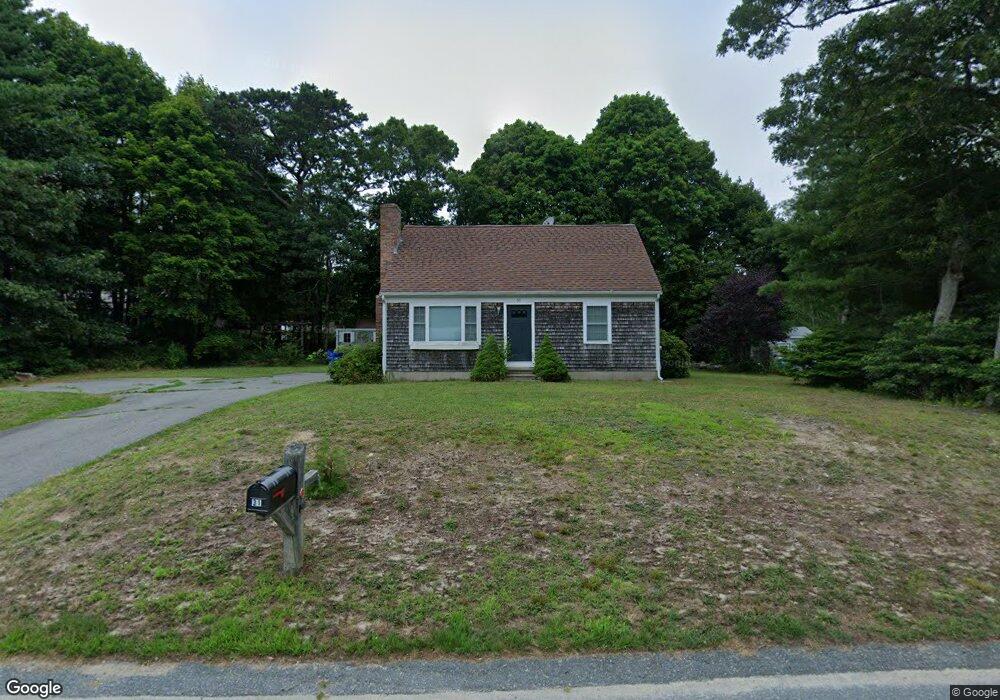
31 Thom Ave Bourne, MA 2532
Monument Beach NeighborhoodEstimated Value: $499,000 - $544,000
3
Beds
2
Baths
1,152
Sq Ft
$455/Sq Ft
Est. Value
About This Home
This home is located at 31 Thom Ave, Bourne, MA 2532 and is currently estimated at $523,618, approximately $454 per square foot. 31 Thom Ave is a home located in Barnstable County with nearby schools including Bourne High School, Cadence Academy Preschool - Bourne, and St Margaret Regional School.
Ownership History
Date
Name
Owned For
Owner Type
Purchase Details
Closed on
Feb 22, 2023
Sold by
Petersen David C and Petersen Pauline C
Bought by
Storer Brian and Storer Lisa
Current Estimated Value
Purchase Details
Closed on
Jan 16, 2014
Sold by
Smith Christopher S and Smith Heather A
Bought by
Petersen David C and Petersen Pauline C
Home Financials for this Owner
Home Financials are based on the most recent Mortgage that was taken out on this home.
Original Mortgage
$120,000
Interest Rate
4.45%
Mortgage Type
New Conventional
Purchase Details
Closed on
Jul 2, 1998
Sold by
Adams Patricia A
Bought by
Smith Christopher S and Cousineau Heather S
Create a Home Valuation Report for This Property
The Home Valuation Report is an in-depth analysis detailing your home's value as well as a comparison with similar homes in the area
Home Values in the Area
Average Home Value in this Area
Purchase History
| Date | Buyer | Sale Price | Title Company |
|---|---|---|---|
| Storer Brian | $429,000 | None Available | |
| Storer Brian | $429,000 | None Available | |
| Petersen David C | $247,000 | -- | |
| Petersen David C | $247,000 | -- | |
| Smith Christopher S | $108,000 | -- | |
| Smith Christopher S | $108,000 | -- |
Source: Public Records
Mortgage History
| Date | Status | Borrower | Loan Amount |
|---|---|---|---|
| Previous Owner | Smith Christopher S | $120,000 |
Source: Public Records
Tax History Compared to Growth
Tax History
| Year | Tax Paid | Tax Assessment Tax Assessment Total Assessment is a certain percentage of the fair market value that is determined by local assessors to be the total taxable value of land and additions on the property. | Land | Improvement |
|---|---|---|---|---|
| 2025 | $3,322 | $425,300 | $187,600 | $237,700 |
| 2024 | $3,202 | $399,300 | $178,600 | $220,700 |
| 2023 | $3,113 | $353,400 | $158,100 | $195,300 |
| 2022 | $2,978 | $295,100 | $139,900 | $155,200 |
| 2021 | $2,900 | $269,300 | $127,300 | $142,000 |
| 2020 | $6,872 | $257,000 | $126,100 | $130,900 |
| 2019 | $6,544 | $249,700 | $126,100 | $123,600 |
| 2018 | $2,447 | $232,200 | $114,400 | $117,800 |
| 2017 | $6,031 | $227,000 | $113,300 | $113,700 |
| 2016 | $2,281 | $224,500 | $113,300 | $111,200 |
| 2015 | $2,261 | $224,500 | $113,300 | $111,200 |
Source: Public Records
Map
Nearby Homes