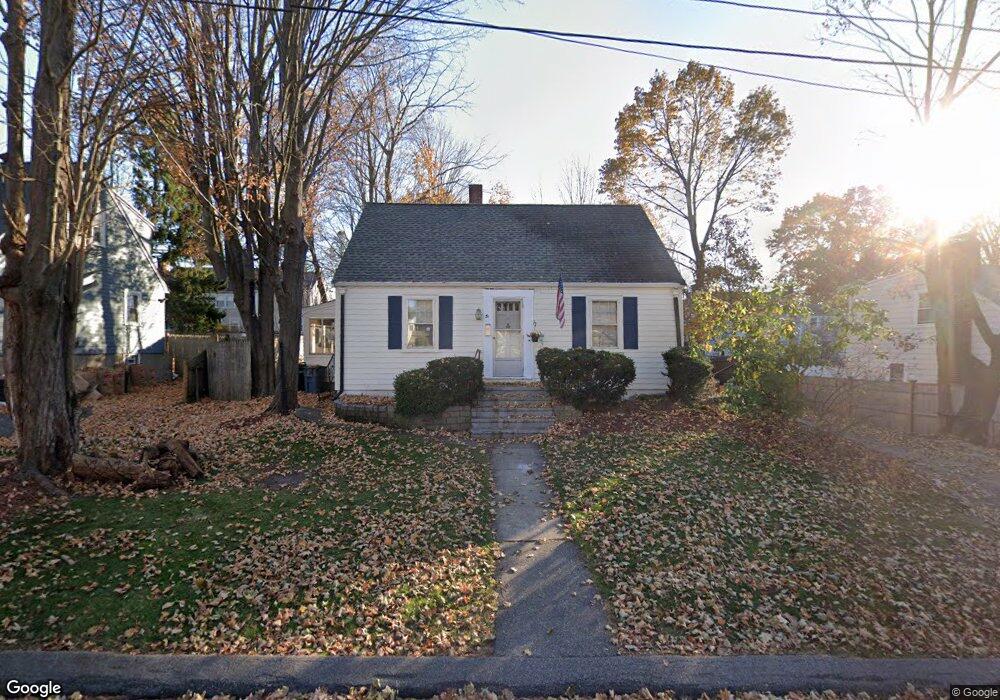
31 Tremont St Stoneham, MA 02180
Colonial Park NeighborhoodEstimated Value: $634,000 - $697,661
2
Beds
2
Baths
1,277
Sq Ft
$515/Sq Ft
Est. Value
About This Home
This home is located at 31 Tremont St, Stoneham, MA 02180 and is currently estimated at $658,165, approximately $515 per square foot. 31 Tremont St is a home located in Middlesex County with nearby schools including Stoneham High School, St. Patrick Elementary School, and St Joseph School.
Ownership History
Date
Name
Owned For
Owner Type
Purchase Details
Closed on
Sep 22, 2020
Sold by
Hook Gary and Hook Mary J
Bought by
Rubin Abraham and Hall Justine
Current Estimated Value
Home Financials for this Owner
Home Financials are based on the most recent Mortgage that was taken out on this home.
Original Mortgage
$384,750
Outstanding Balance
$341,440
Interest Rate
2.9%
Mortgage Type
New Conventional
Estimated Equity
$316,725
Purchase Details
Closed on
Mar 29, 1999
Sold by
Hook Cornelia T
Bought by
Hook Gary and Hook Mary J
Create a Home Valuation Report for This Property
The Home Valuation Report is an in-depth analysis detailing your home's value as well as a comparison with similar homes in the area
Home Values in the Area
Average Home Value in this Area
Purchase History
| Date | Buyer | Sale Price | Title Company |
|---|---|---|---|
| Rubin Abraham | $405,000 | None Available | |
| Hook Gary | $100,000 | -- |
Source: Public Records
Mortgage History
| Date | Status | Borrower | Loan Amount |
|---|---|---|---|
| Open | Rubin Abraham | $384,750 | |
| Previous Owner | Hook Gary | $115,000 | |
| Previous Owner | Hook Gary | $160,000 | |
| Previous Owner | Hook Gary | $58,306 |
Source: Public Records
Tax History Compared to Growth
Tax History
| Year | Tax Paid | Tax Assessment Tax Assessment Total Assessment is a certain percentage of the fair market value that is determined by local assessors to be the total taxable value of land and additions on the property. | Land | Improvement |
|---|---|---|---|---|
| 2025 | $5,638 | $551,100 | $358,400 | $192,700 |
| 2024 | $5,331 | $503,400 | $330,100 | $173,300 |
| 2023 | $5,219 | $470,200 | $301,800 | $168,400 |
| 2022 | $4,516 | $433,800 | $273,500 | $160,300 |
| 2021 | $4,560 | $421,400 | $264,100 | $157,300 |
| 2020 | $4,294 | $398,000 | $251,600 | $146,400 |
| 2019 | $4,444 | $396,100 | $238,600 | $157,500 |
| 2018 | $4,236 | $361,700 | $214,300 | $147,400 |
| 2017 | $4,100 | $330,900 | $200,000 | $130,900 |
| 2016 | $4,102 | $323,000 | $200,000 | $123,000 |
| 2015 | $3,914 | $302,000 | $190,900 | $111,100 |
| 2014 | $3,963 | $293,800 | $181,800 | $112,000 |
Source: Public Records
Map
Nearby Homes
- 21 Tremont St Unit A
- 1 Tremont St
- 13 Washington Ave
- 43 Pomeworth St Unit 44
- 25 Penny Ln
- 20 Myrtle St
- 106 Elm St
- 10 Pomeworth St Unit H
- 34 Duncklee Ave
- 59 Norval Ave
- 8 Steele St
- 20 Oak St
- 159 Main St Unit 41C
- 4 Vernon Ave
- 12 Cottage St
- 17 Emerson St Unit A
- 17A 17 B Emerson
- 62 High St Unit 4
- 62 High St Unit 3
- 62 High St Unit Lot 12