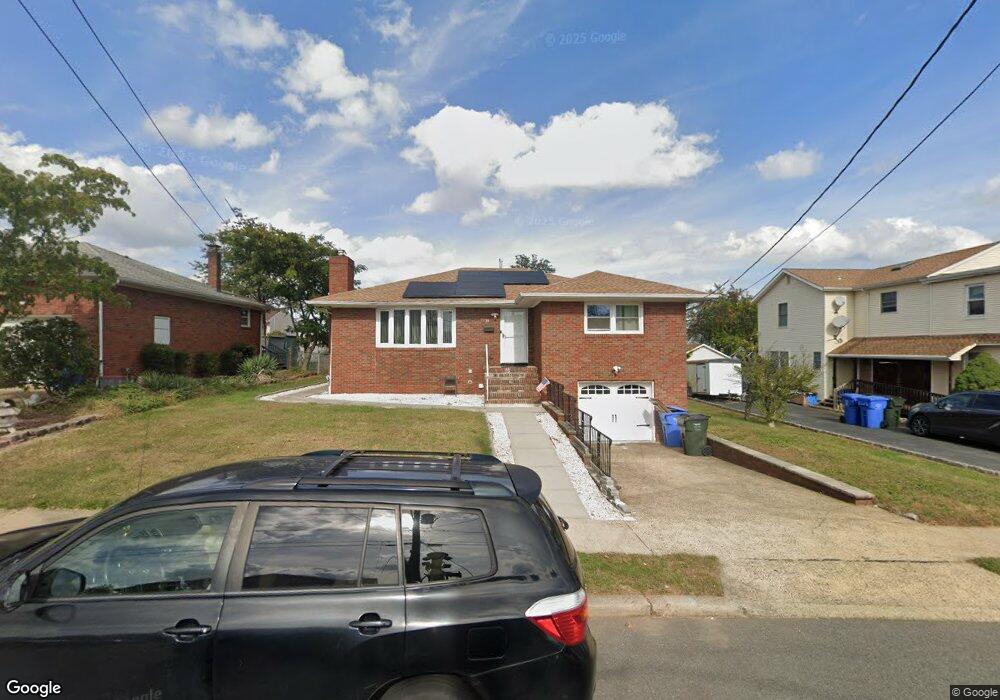
31 W 5th St Port Reading, NJ 07064
Estimated Value: $431,658 - $698,000
--
Bed
--
Bath
1,399
Sq Ft
$425/Sq Ft
Est. Value
About This Home
This home is located at 31 W 5th St, Port Reading, NJ 07064 and is currently estimated at $595,165, approximately $425 per square foot. 31 W 5th St is a home located in Middlesex County with nearby schools including Port Reading Elementary School, Avenel Middle School, and Woodbridge High School.
Ownership History
Date
Name
Owned For
Owner Type
Purchase Details
Closed on
Feb 15, 2019
Sold by
Singh Dhian and Singh Amrik
Bought by
Singh Dhian
Current Estimated Value
Home Financials for this Owner
Home Financials are based on the most recent Mortgage that was taken out on this home.
Original Mortgage
$220,000
Outstanding Balance
$193,025
Interest Rate
4.4%
Mortgage Type
New Conventional
Estimated Equity
$402,140
Purchase Details
Closed on
Jan 27, 2016
Sold by
Tamburri Maria Depascale and Rothenberg Antonietta
Bought by
Singh Amrik and Singh Dhian
Home Financials for this Owner
Home Financials are based on the most recent Mortgage that was taken out on this home.
Original Mortgage
$260,000
Interest Rate
3.97%
Mortgage Type
New Conventional
Purchase Details
Closed on
Mar 20, 1969
Bought by
Depascale Nancy
Create a Home Valuation Report for This Property
The Home Valuation Report is an in-depth analysis detailing your home's value as well as a comparison with similar homes in the area
Home Values in the Area
Average Home Value in this Area
Purchase History
| Date | Buyer | Sale Price | Title Company |
|---|---|---|---|
| Singh Dhian | -- | Golden Title Agency Llc | |
| Singh Amrik | $310,000 | None Available | |
| Depascale Nancy | -- | -- |
Source: Public Records
Mortgage History
| Date | Status | Borrower | Loan Amount |
|---|---|---|---|
| Open | Singh Dhian | $220,000 | |
| Closed | Singh Amrik | $260,000 |
Source: Public Records
Tax History Compared to Growth
Tax History
| Year | Tax Paid | Tax Assessment Tax Assessment Total Assessment is a certain percentage of the fair market value that is determined by local assessors to be the total taxable value of land and additions on the property. | Land | Improvement |
|---|---|---|---|---|
| 2025 | $11,738 | $88,100 | $19,900 | $68,200 |
| 2024 | $11,396 | $88,100 | $19,900 | $68,200 |
| 2023 | $11,396 | $88,100 | $19,900 | $68,200 |
| 2022 | $11,114 | $88,100 | $19,900 | $68,200 |
| 2021 | $10,666 | $88,100 | $19,900 | $68,200 |
| 2020 | $10,310 | $88,100 | $19,900 | $68,200 |
| 2019 | $10,017 | $88,100 | $19,900 | $68,200 |
| 2018 | $9,814 | $88,100 | $19,900 | $68,200 |
| 2017 | $9,617 | $88,100 | $19,900 | $68,200 |
| 2016 | $9,521 | $88,100 | $19,900 | $68,200 |
| 2015 | $9,325 | $82,200 | $19,900 | $62,300 |
| 2014 | $8,476 | $82,200 | $19,900 | $62,300 |
Source: Public Records
Map
Nearby Homes