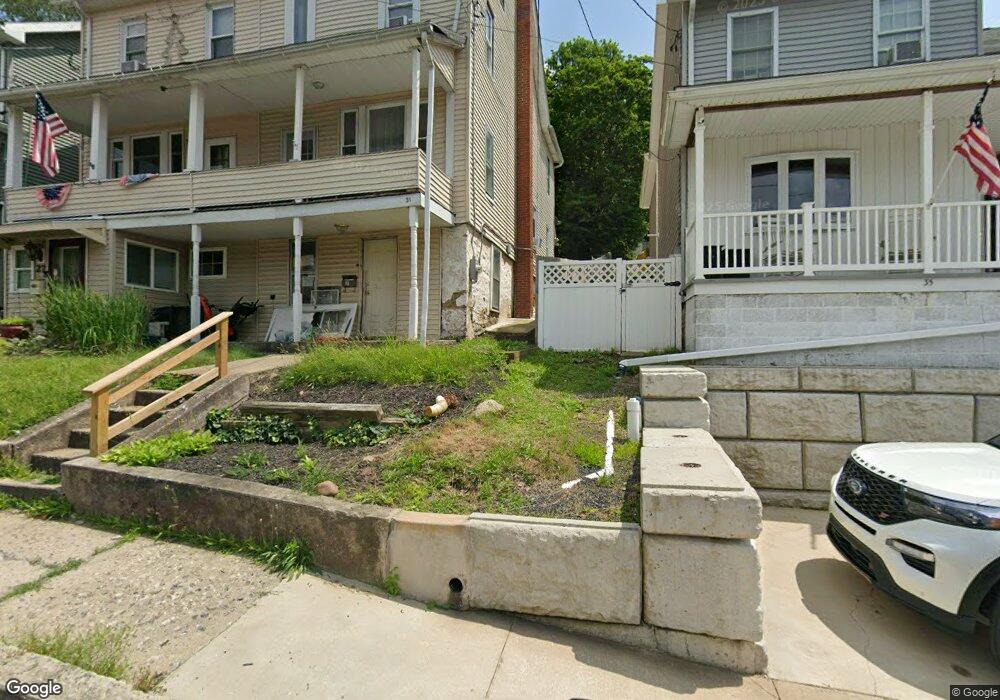
31 W High St Nesquehoning, PA 18240
Estimated Value: $42,000 - $76,000
3
Beds
1
Bath
1,280
Sq Ft
$44/Sq Ft
Est. Value
About This Home
This home is located at 31 W High St, Nesquehoning, PA 18240 and is currently estimated at $56,000, approximately $43 per square foot. 31 W High St is a home located in Carbon County with nearby schools including Panther Valley Elementary School, Panther Valley Intermediate School, and Panther Valley Junior/Senior High School.
Ownership History
Date
Name
Owned For
Owner Type
Purchase Details
Closed on
Dec 17, 2024
Sold by
Graham Jerel
Bought by
Salet Ihab and Salet Renee
Current Estimated Value
Purchase Details
Closed on
Dec 18, 2021
Sold by
Carbon Judicial 2014 Trust
Bought by
Graham Jerel
Purchase Details
Closed on
Dec 11, 2014
Sold by
Fegley Jesse W
Bought by
Carbon Judicial 2014 Trust
Create a Home Valuation Report for This Property
The Home Valuation Report is an in-depth analysis detailing your home's value as well as a comparison with similar homes in the area
Home Values in the Area
Average Home Value in this Area
Purchase History
| Date | Buyer | Sale Price | Title Company |
|---|---|---|---|
| Salet Ihab | $43,220 | None Listed On Document | |
| Graham Jerel | $15,000 | None Available | |
| Carbon Judicial 2014 Trust | $4,300 | None Available |
Source: Public Records
Tax History Compared to Growth
Tax History
| Year | Tax Paid | Tax Assessment Tax Assessment Total Assessment is a certain percentage of the fair market value that is determined by local assessors to be the total taxable value of land and additions on the property. | Land | Improvement |
|---|---|---|---|---|
| 2025 | $1,909 | $20,200 | $4,100 | $16,100 |
| 2024 | $1,987 | $20,200 | $4,100 | $16,100 |
| 2023 | $1,946 | $20,200 | $4,100 | $16,100 |
| 2022 | $1,959 | $20,200 | $4,100 | $16,100 |
| 2021 | $1,959 | $20,200 | $4,100 | $16,100 |
| 2020 | $1,929 | $20,200 | $4,100 | $16,100 |
| 2019 | $1,818 | $20,200 | $4,100 | $16,100 |
| 2018 | $1,798 | $20,200 | $4,100 | $16,100 |
| 2017 | $1,798 | $20,200 | $4,100 | $16,100 |
| 2016 | -- | $20,200 | $4,100 | $16,100 |
| 2015 | -- | $20,200 | $4,100 | $16,100 |
| 2014 | -- | $20,200 | $4,100 | $16,100 |
Source: Public Records
Map
Nearby Homes
- 1 W High St
- 134 W Railroad St Unit 136
- 153 W High St
- 41 E Catawissa St
- 2 W Catawissa St
- 229 W High St
- 142 E Center St
- 34 Coal St
- 61 Rhume St
- 142 E Catawissa St
- 158162 Coal St
- 58 W Columbus Ave
- 105 E Columbus Ave
- 24 W Garibaldi Ave
- 20 W Garibaldi Ave
- 117 E Garibaldi Ave
- 116 Spruce St
- 129 Lentz Trail
- 0 11th Ave Unit PM-131093
- 0 Birch Dr Unit 759990