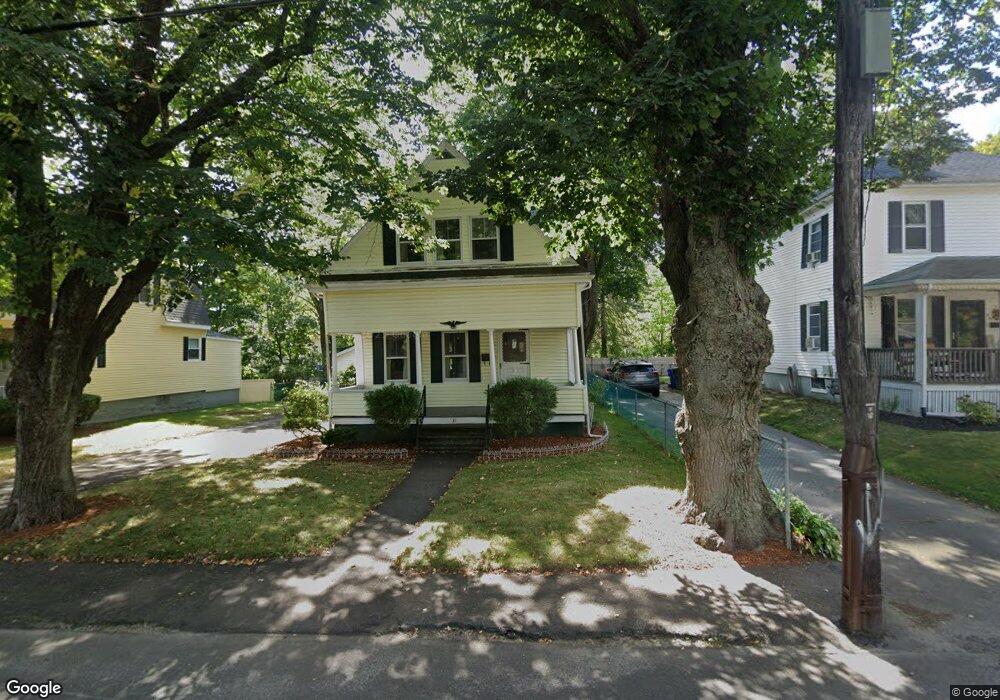
31 W Weir St Taunton, MA 02780
Estimated Value: $373,000 - $416,000
3
Beds
1
Bath
1,113
Sq Ft
$359/Sq Ft
Est. Value
About This Home
This home is located at 31 W Weir St, Taunton, MA 02780 and is currently estimated at $399,678, approximately $359 per square foot. 31 W Weir St is a home located in Bristol County with nearby schools including Mulcahey Elementary School, Taunton High School, and John F. Parker Middle School.
Ownership History
Date
Name
Owned For
Owner Type
Purchase Details
Closed on
Nov 2, 1999
Sold by
Pennington M Carol
Bought by
Knott Richard
Current Estimated Value
Home Financials for this Owner
Home Financials are based on the most recent Mortgage that was taken out on this home.
Original Mortgage
$20,000
Interest Rate
7.86%
Create a Home Valuation Report for This Property
The Home Valuation Report is an in-depth analysis detailing your home's value as well as a comparison with similar homes in the area
Home Values in the Area
Average Home Value in this Area
Purchase History
| Date | Buyer | Sale Price | Title Company |
|---|---|---|---|
| Knott Richard | $40,000 | -- |
Source: Public Records
Mortgage History
| Date | Status | Borrower | Loan Amount |
|---|---|---|---|
| Open | Knott Richard | $45,000 | |
| Closed | Knott Richard | $20,000 | |
| Closed | Knott Richard | $46,000 |
Source: Public Records
Tax History Compared to Growth
Tax History
| Year | Tax Paid | Tax Assessment Tax Assessment Total Assessment is a certain percentage of the fair market value that is determined by local assessors to be the total taxable value of land and additions on the property. | Land | Improvement |
|---|---|---|---|---|
| 2025 | $3,452 | $315,500 | $96,100 | $219,400 |
| 2024 | $3,092 | $276,300 | $96,100 | $180,200 |
| 2023 | $3,051 | $253,200 | $96,100 | $157,100 |
| 2022 | $2,910 | $220,800 | $80,100 | $140,700 |
| 2021 | $2,797 | $197,000 | $72,800 | $124,200 |
| 2020 | $2,699 | $181,600 | $72,800 | $108,800 |
| 2019 | $2,602 | $165,100 | $72,800 | $92,300 |
| 2018 | $2,523 | $160,500 | $72,600 | $87,900 |
| 2017 | $2,276 | $144,900 | $68,800 | $76,100 |
| 2016 | $2,206 | $140,700 | $66,800 | $73,900 |
| 2015 | $2,179 | $145,200 | $67,500 | $77,700 |
| 2014 | $2,097 | $143,500 | $64,700 | $78,800 |
Source: Public Records
Map
Nearby Homes
- 22 Everett St
- 72 Barnum St
- 16 Clinton St
- 132 Winthrop St
- 56 Silver St
- 278 Cohannet St
- 98 Winthrop St
- 252 Somerset Ave
- 46 Harrison St Unit 4
- 4 Parkin Ct
- 19 Mason St
- 24 1st St
- 39 Myrtle St
- 193 Winthrop St
- 450 Somerset Ave Unit 2-7
- 450 Somerset Ave Unit 6-6
- 125 Highland St Unit 103
- 24 Highland Terrace
- 48 Oak St
- 215 High St Unit 21