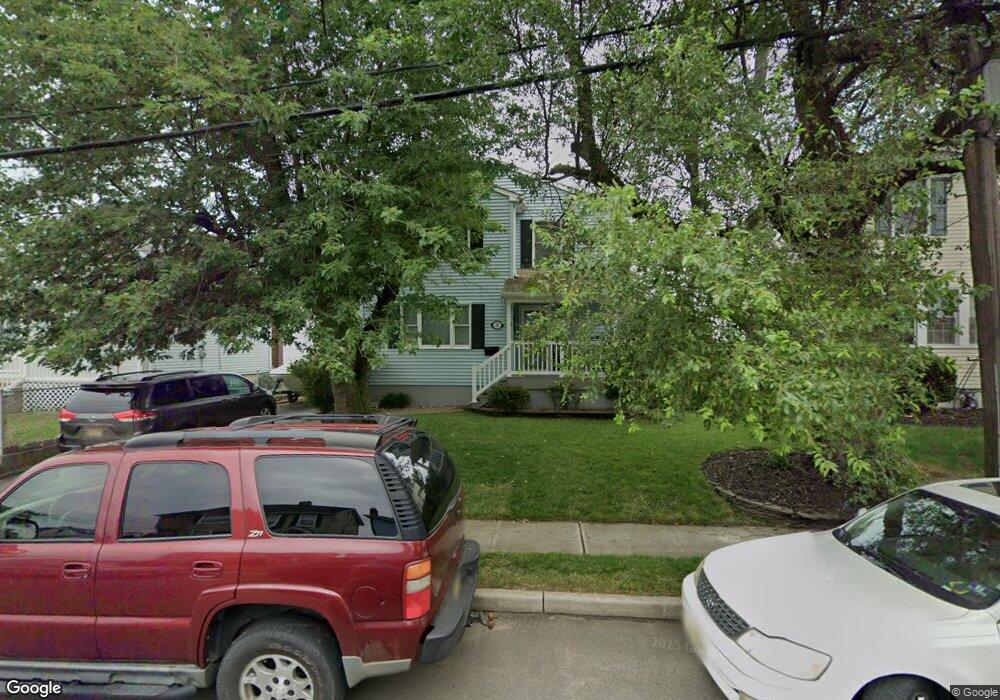
31 Walling Terrace Keyport, NJ 07735
Estimated Value: $559,236 - $614,000
4
Beds
2
Baths
1,794
Sq Ft
$327/Sq Ft
Est. Value
About This Home
This home is located at 31 Walling Terrace, Keyport, NJ 07735 and is currently estimated at $586,059, approximately $326 per square foot. 31 Walling Terrace is a home located in Monmouth County with nearby schools including Keyport Central School, Keyport High School, and Icob Academy.
Ownership History
Date
Name
Owned For
Owner Type
Purchase Details
Closed on
Mar 27, 2003
Sold by
Ribeiro Marilyn
Bought by
Hausmann John and Hausmann Aimee
Current Estimated Value
Home Financials for this Owner
Home Financials are based on the most recent Mortgage that was taken out on this home.
Original Mortgage
$175,000
Interest Rate
5.93%
Create a Home Valuation Report for This Property
The Home Valuation Report is an in-depth analysis detailing your home's value as well as a comparison with similar homes in the area
Home Values in the Area
Average Home Value in this Area
Purchase History
| Date | Buyer | Sale Price | Title Company |
|---|---|---|---|
| Hausmann John | $239,000 | -- |
Source: Public Records
Mortgage History
| Date | Status | Borrower | Loan Amount |
|---|---|---|---|
| Previous Owner | Hausmann John | $175,000 |
Source: Public Records
Tax History
| Year | Tax Paid | Tax Assessment Tax Assessment Total Assessment is a certain percentage of the fair market value that is determined by local assessors to be the total taxable value of land and additions on the property. | Land | Improvement |
|---|---|---|---|---|
| 2025 | $9,276 | $490,800 | $227,800 | $263,000 |
| 2024 | $9,148 | $448,100 | $198,100 | $250,000 |
Source: Public Records
Map
Nearby Homes
- 9 Kearney St Unit A
- 226 Osborn St
- 9 Hurley St
- 104 Church St
- 75 Broad St
- 155 Luppatatong Ave
- 231 Atlantic St Unit 23
- 231 Atlantic St Unit 83
- 2 Chingarora Ave
- 87 Church St
- 95 Broadway
- 40 Church St
- 6 Octavia Place
- 253 Broadway
- 55 E Front St
- 72 1st St
- 55 1st St Unit 2
- 72 Manchester Ave
- 74 Manchester Ave
- 52 Highway 35
- 33 Walling Terrace
- 29 Walling Terrace
- 35 Walling Terrace
- 27 Walling Terrace
- 47 Walling Terrace
- 80 Maple Place
- 76 Maple Place
- 90 Maple Place
- 38 Walling Terrace
- 34 Walling Terrace
- 72 Maple Place
- 94 Maple Place
- 50 Walling Terrace
- 40 Walling Terrace
- 3 Walling Terrace
- 169 Beers St
- 175 Beers St
- 32 Walling Terrace
- 68 Maple Place
- 165 Beers St
Your Personal Tour Guide
Ask me questions while you tour the home.