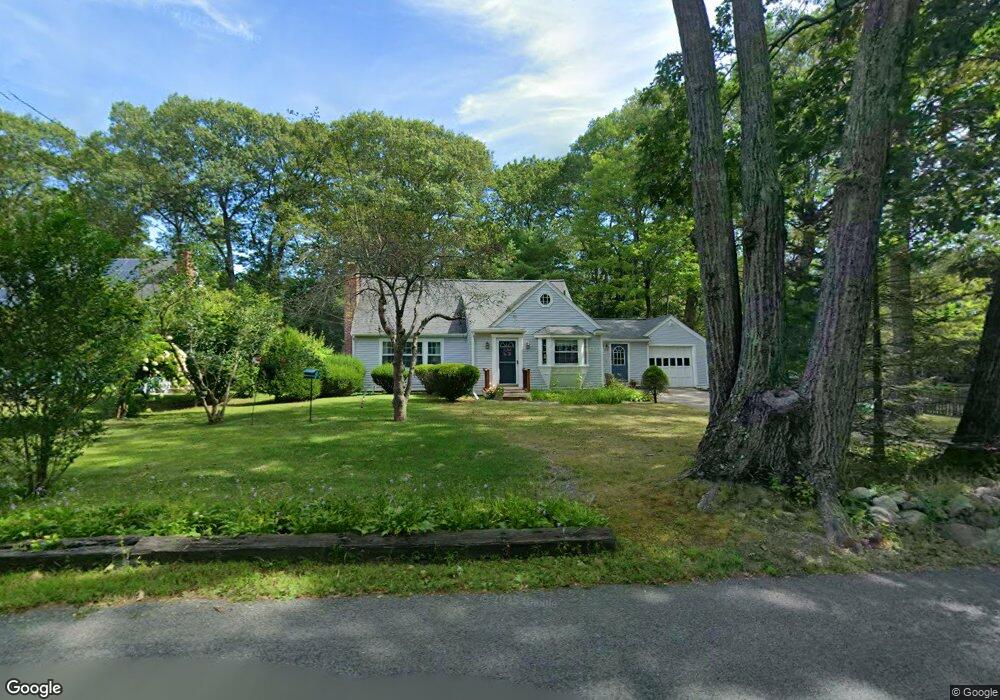
31 Walnut St Plainville, MA 02762
Estimated Value: $539,854 - $646,000
3
Beds
2
Baths
1,966
Sq Ft
$301/Sq Ft
Est. Value
About This Home
This home is located at 31 Walnut St, Plainville, MA 02762 and is currently estimated at $591,464, approximately $300 per square foot. 31 Walnut St is a home located in Norfolk County with nearby schools including Anna Ware Jackson School, Beatrice H. Wood Elementary School, and Discovery Daycare Center.
Ownership History
Date
Name
Owned For
Owner Type
Purchase Details
Closed on
Sep 23, 2022
Sold by
Mealy Robert M and Mealy Paula J
Bought by
Mealy Ft and Mealy
Current Estimated Value
Purchase Details
Closed on
Mar 1, 1988
Sold by
Stockman Richard E
Bought by
Mealy Robert M
Home Financials for this Owner
Home Financials are based on the most recent Mortgage that was taken out on this home.
Original Mortgage
$118,000
Interest Rate
10.49%
Mortgage Type
Purchase Money Mortgage
Create a Home Valuation Report for This Property
The Home Valuation Report is an in-depth analysis detailing your home's value as well as a comparison with similar homes in the area
Home Values in the Area
Average Home Value in this Area
Purchase History
| Date | Buyer | Sale Price | Title Company |
|---|---|---|---|
| Mealy Ft | -- | None Available | |
| Mealy Robert M | $132,000 | -- |
Source: Public Records
Mortgage History
| Date | Status | Borrower | Loan Amount |
|---|---|---|---|
| Previous Owner | Mealy Robert M | $113,000 | |
| Previous Owner | Mealy Robert M | $118,000 |
Source: Public Records
Tax History
| Year | Tax Paid | Tax Assessment Tax Assessment Total Assessment is a certain percentage of the fair market value that is determined by local assessors to be the total taxable value of land and additions on the property. | Land | Improvement |
|---|---|---|---|---|
| 2025 | $5,488 | $474,700 | $234,700 | $240,000 |
| 2024 | $5,154 | $429,500 | $211,500 | $218,000 |
| 2023 | $5,121 | $410,300 | $211,500 | $198,800 |
| 2022 | $5,087 | $362,600 | $203,600 | $159,000 |
| 2021 | $4,994 | $339,700 | $203,600 | $136,100 |
| 2020 | $5,132 | $349,100 | $203,600 | $145,500 |
| 2019 | $4,750 | $317,300 | $194,200 | $123,100 |
Source: Public Records
Map
Nearby Homes
- 5 Farm Hill Ln
- 19 Valerie Dr
- 9 Fletcher St
- 20 South St
- 102 High St
- 35-R Whiting St
- 31 Whiting St
- 218 High St
- 1 Chestnut St
- 271 N Washington St
- 18 Huntington Ave
- 0 Berry St
- 3 Riley Ct
- 117 Church St Unit 4
- 20 Woodridge St
- 88 Arnold Rd
- 19 Chestnut St Lot 2
- 19 Chestnut St Lot 3
- 16 Johnson St
- 28 Sunset Ln
Your Personal Tour Guide
Ask me questions while you tour the home.