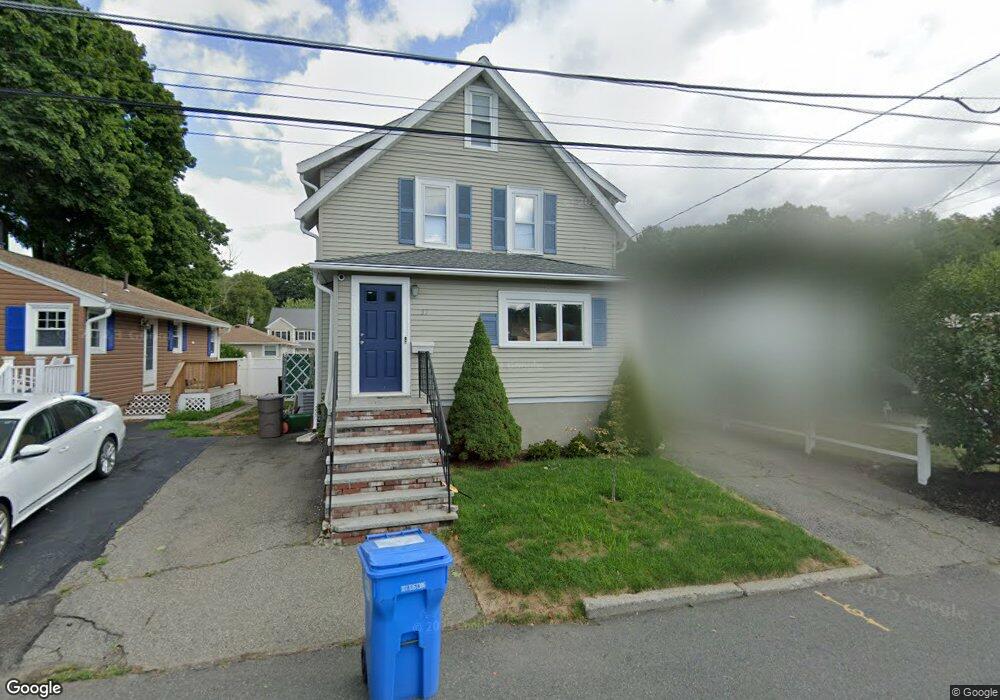
31 Wampum Ave Waltham, MA 02451
Lakeview NeighborhoodEstimated Value: $650,658 - $749,000
4
Beds
1
Bath
1,334
Sq Ft
$511/Sq Ft
Est. Value
About This Home
This home is located at 31 Wampum Ave, Waltham, MA 02451 and is currently estimated at $681,915, approximately $511 per square foot. 31 Wampum Ave is a home located in Middlesex County with nearby schools including Douglas Macarthur Elementary School, John F Kennedy Middle School, and Waltham Sr High School.
Ownership History
Date
Name
Owned For
Owner Type
Purchase Details
Closed on
Aug 19, 2025
Sold by
Pentikis Evangelia and Pentikis Charles A
Bought by
Du Shenghua and Ma Ziyan
Current Estimated Value
Home Financials for this Owner
Home Financials are based on the most recent Mortgage that was taken out on this home.
Original Mortgage
$594,000
Outstanding Balance
$592,433
Interest Rate
6.67%
Mortgage Type
New Conventional
Estimated Equity
$89,482
Purchase Details
Closed on
Dec 10, 1997
Sold by
Lapira Renzo and Lapira Ernestina
Bought by
Pentikis Evangelia and Pentikis Charles A
Home Financials for this Owner
Home Financials are based on the most recent Mortgage that was taken out on this home.
Original Mortgage
$70,500
Interest Rate
7.14%
Mortgage Type
Purchase Money Mortgage
Purchase Details
Closed on
Dec 11, 1995
Sold by
Massachusetts Comm Of
Bought by
Lapira Renzo and Lapira Ernestina
Create a Home Valuation Report for This Property
The Home Valuation Report is an in-depth analysis detailing your home's value as well as a comparison with similar homes in the area
Home Values in the Area
Average Home Value in this Area
Purchase History
| Date | Buyer | Sale Price | Title Company |
|---|---|---|---|
| Du Shenghua | $660,000 | -- | |
| Du Shenghua | $660,000 | -- | |
| Pentikis Evangelia | $175,000 | -- | |
| Pentikis Evangelia | $175,000 | -- | |
| Lapira Renzo | $149,500 | -- | |
| Lapira Renzo | $149,500 | -- |
Source: Public Records
Mortgage History
| Date | Status | Borrower | Loan Amount |
|---|---|---|---|
| Open | Du Shenghua | $594,000 | |
| Closed | Du Shenghua | $594,000 | |
| Previous Owner | Lapira Renzo | $32,120 | |
| Previous Owner | Lapira Renzo | $70,500 |
Source: Public Records
Tax History Compared to Growth
Tax History
| Year | Tax Paid | Tax Assessment Tax Assessment Total Assessment is a certain percentage of the fair market value that is determined by local assessors to be the total taxable value of land and additions on the property. | Land | Improvement |
|---|---|---|---|---|
| 2025 | $5,512 | $561,300 | $326,500 | $234,800 |
| 2024 | $5,241 | $543,700 | $311,000 | $232,700 |
| 2023 | $5,113 | $495,400 | $283,900 | $211,500 |
| 2022 | $5,179 | $464,900 | $256,900 | $208,000 |
| 2021 | $10,050 | $454,500 | $256,900 | $197,600 |
| 2020 | $5,172 | $432,800 | $243,400 | $189,400 |
| 2019 | $4,702 | $371,400 | $229,300 | $142,100 |
| 2018 | $154,189 | $342,600 | $212,300 | $130,300 |
| 2017 | $8,072 | $323,000 | $192,700 | $130,300 |
| 2016 | $3,796 | $310,100 | $179,800 | $130,300 |
| 2015 | $3,930 | $299,300 | $169,000 | $130,300 |
Source: Public Records
Map
Nearby Homes
- 30 Wampum Ave
- 133 Lake St
- 129 Lake St
- 14 Piedmont Ave
- 234 Lake St
- 249 Lake St
- 65 Montclair Ave
- 30 Jacqueline Rd Unit C
- 98 Seminole Ave
- 28 Hillcrest St
- 44 Sachem St
- 28 College Farm Rd Unit 2
- 463 Lincoln St
- 15 Kings Way Unit 25
- 92 Milner St
- 11 Autumn Ln
- 1105 Lexington St Unit 102
- 15 Cedarcroft Ln
- 107 Clocktower Dr Unit 3302
- 87 Clocktower Dr Unit 2207