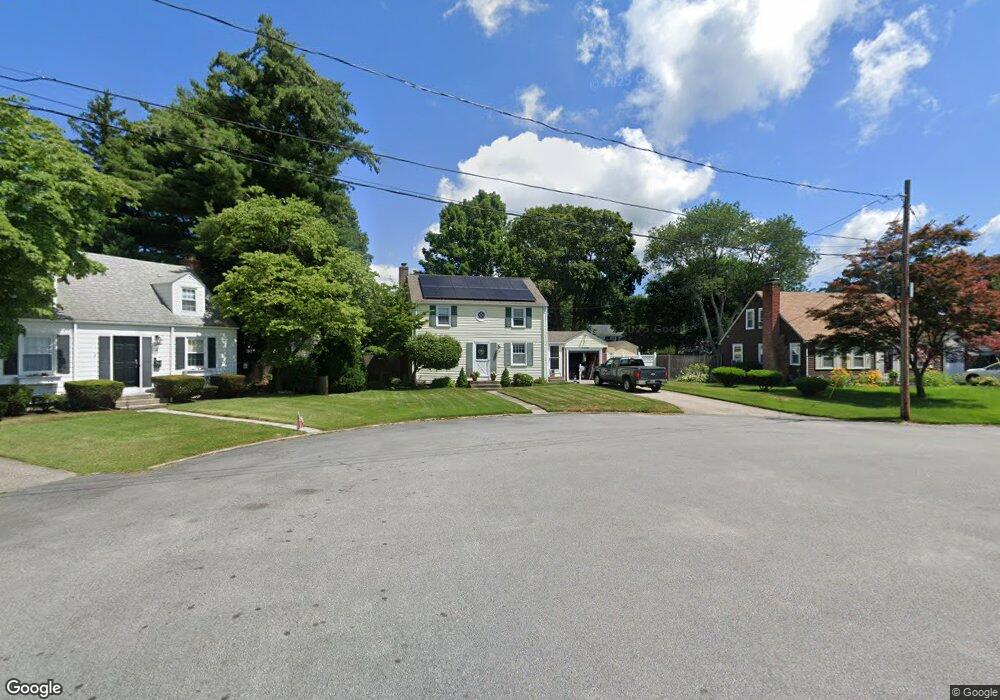
31 Westbrook Rd Warwick, RI 02886
Hillsgrove NeighborhoodEstimated Value: $396,887 - $457,000
3
Beds
2
Baths
1,272
Sq Ft
$328/Sq Ft
Est. Value
About This Home
This home is located at 31 Westbrook Rd, Warwick, RI 02886 and is currently estimated at $417,472, approximately $328 per square foot. 31 Westbrook Rd is a home located in Kent County with nearby schools including St Rose Of Lima School.
Ownership History
Date
Name
Owned For
Owner Type
Purchase Details
Closed on
Apr 25, 1995
Sold by
Young Paul F and Rinaldi Carol L
Bought by
Horton Michael D and Horton Maureen
Current Estimated Value
Home Financials for this Owner
Home Financials are based on the most recent Mortgage that was taken out on this home.
Original Mortgage
$20,800
Interest Rate
8.33%
Create a Home Valuation Report for This Property
The Home Valuation Report is an in-depth analysis detailing your home's value as well as a comparison with similar homes in the area
Home Values in the Area
Average Home Value in this Area
Purchase History
| Date | Buyer | Sale Price | Title Company |
|---|---|---|---|
| Horton Michael D | $128,000 | -- |
Source: Public Records
Mortgage History
| Date | Status | Borrower | Loan Amount |
|---|---|---|---|
| Closed | Horton Michael D | $91,000 | |
| Closed | Horton Michael D | $20,800 | |
| Closed | Horton Michael D | $88,000 |
Source: Public Records
Tax History
| Year | Tax Paid | Tax Assessment Tax Assessment Total Assessment is a certain percentage of the fair market value that is determined by local assessors to be the total taxable value of land and additions on the property. | Land | Improvement |
|---|---|---|---|---|
| 2025 | $4,360 | $343,300 | $105,300 | $238,000 |
| 2024 | $4,114 | $284,300 | $87,000 | $197,300 |
| 2023 | $4,034 | $284,300 | $87,000 | $197,300 |
| 2022 | $3,978 | $212,400 | $57,400 | $155,000 |
| 2021 | $3,978 | $212,400 | $57,400 | $155,000 |
| 2020 | $3,978 | $212,400 | $57,400 | $155,000 |
| 2019 | $3,978 | $212,400 | $57,400 | $155,000 |
| 2018 | $3,405 | $163,700 | $48,500 | $115,200 |
| 2017 | $3,313 | $163,700 | $48,500 | $115,200 |
| 2016 | $3,313 | $163,700 | $48,500 | $115,200 |
| 2015 | $3,469 | $167,200 | $60,100 | $107,100 |
| 2014 | $3,354 | $167,200 | $60,100 | $107,100 |
| 2013 | $3,309 | $167,200 | $60,100 | $107,100 |
Source: Public Records
Map
Nearby Homes
Your Personal Tour Guide
Ask me questions while you tour the home.