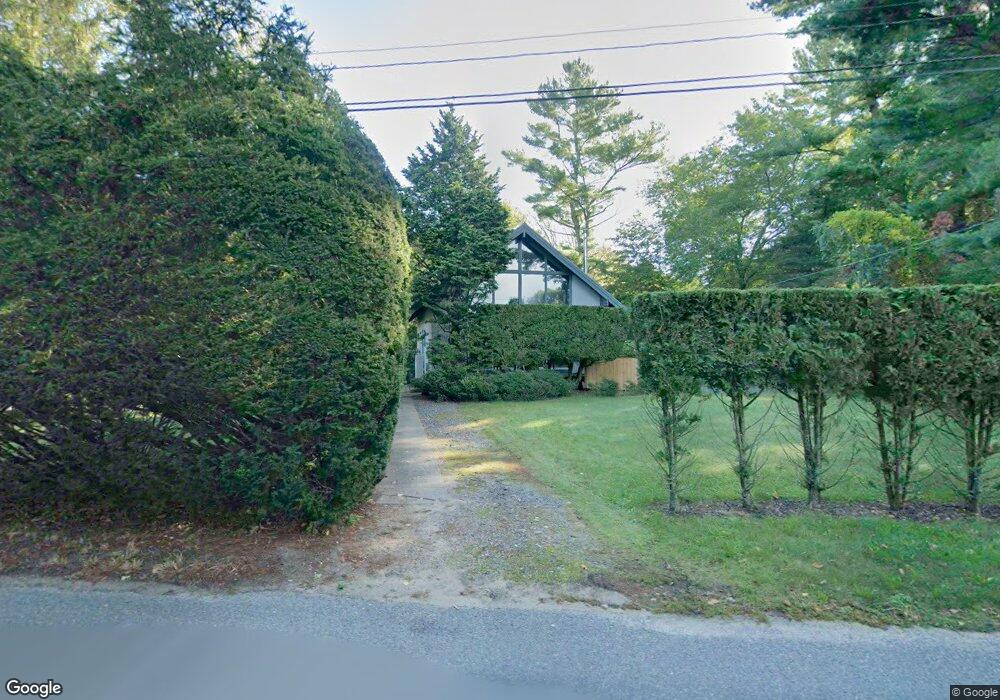
31 Wheeler St Rehoboth, MA 02769
Estimated Value: $607,000 - $748,000
3
Beds
2
Baths
1,900
Sq Ft
$345/Sq Ft
Est. Value
About This Home
This home is located at 31 Wheeler St, Rehoboth, MA 02769 and is currently estimated at $656,183, approximately $345 per square foot. 31 Wheeler St is a home located in Bristol County with nearby schools including Dighton-Rehoboth Regional High School and Cedar Brook School.
Ownership History
Date
Name
Owned For
Owner Type
Purchase Details
Closed on
Nov 5, 1999
Sold by
Cullen Thomas M
Bought by
Mayo Thomas G
Current Estimated Value
Home Financials for this Owner
Home Financials are based on the most recent Mortgage that was taken out on this home.
Original Mortgage
$80,000
Outstanding Balance
$24,386
Interest Rate
7.73%
Mortgage Type
Purchase Money Mortgage
Estimated Equity
$631,797
Create a Home Valuation Report for This Property
The Home Valuation Report is an in-depth analysis detailing your home's value as well as a comparison with similar homes in the area
Home Values in the Area
Average Home Value in this Area
Purchase History
| Date | Buyer | Sale Price | Title Company |
|---|---|---|---|
| Mayo Thomas G | $200,000 | -- |
Source: Public Records
Mortgage History
| Date | Status | Borrower | Loan Amount |
|---|---|---|---|
| Open | Mayo Thomas G | $80,000 | |
| Previous Owner | Mayo Thomas G | $85,000 |
Source: Public Records
Tax History Compared to Growth
Tax History
| Year | Tax Paid | Tax Assessment Tax Assessment Total Assessment is a certain percentage of the fair market value that is determined by local assessors to be the total taxable value of land and additions on the property. | Land | Improvement |
|---|---|---|---|---|
| 2025 | $51 | $453,300 | $183,900 | $269,400 |
| 2024 | $4,900 | $431,300 | $200,600 | $230,700 |
| 2023 | $4,508 | $423,700 | $196,700 | $227,000 |
| 2022 | $4,508 | $355,800 | $180,300 | $175,500 |
| 2021 | $4,615 | $348,600 | $163,900 | $184,700 |
| 2020 | $4,600 | $350,600 | $171,700 | $178,900 |
| 2018 | $3,595 | $300,300 | $148,600 | $151,700 |
| 2017 | $3,527 | $280,800 | $148,600 | $132,200 |
| 2016 | $3,341 | $275,000 | $148,600 | $126,400 |
| 2015 | $3,489 | $283,400 | $141,500 | $141,900 |
| 2014 | $3,321 | $267,000 | $134,800 | $132,200 |
Source: Public Records
Map
Nearby Homes
- 67 Wheeler St
- 0 Winter St
- 20 School St
- 111 Summer St
- 23 Colonial Way
- 37 Colonial Way
- 9 Hidden Hills Dr
- 198 Brook St
- 6 Running Stream Rd
- 15 Hickory Ridge Rd
- 8 Linden Ln
- 8 Linden Ln
- 25 Lincoln St
- 205 Providence St Bldr Lot 3
- 203 Providence St Bldr Lot 5
- 16 Salisbury St
- 63 Moulton St
- 31 Woodland Way
- 248 County
- 824 Taunton Ave