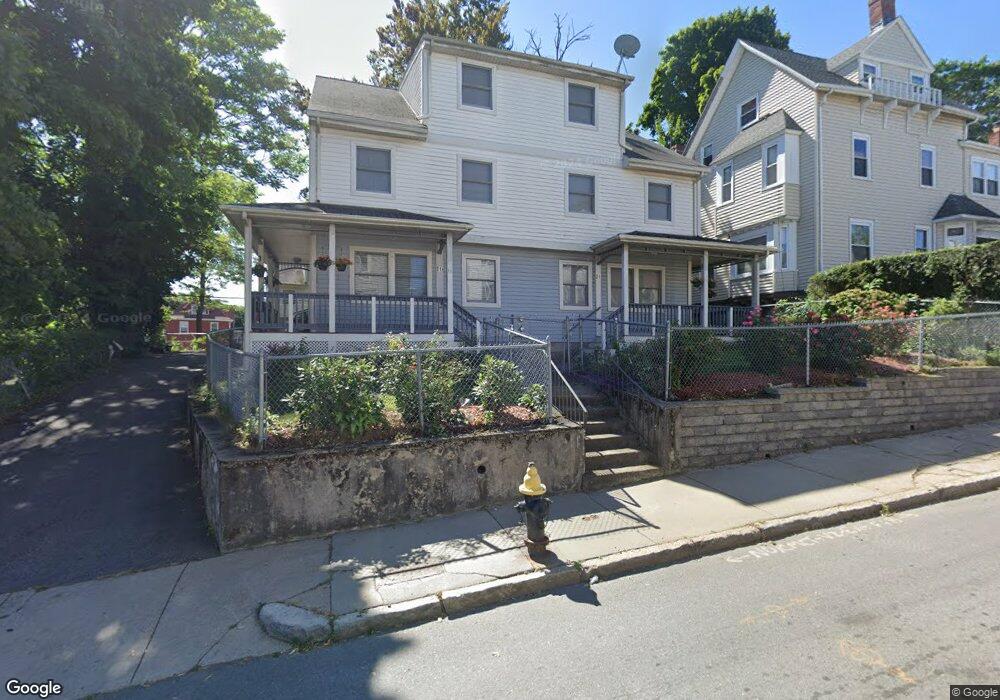
31 Whiting St Unit 31A Roxbury, MA 02119
Sav-Mor NeighborhoodEstimated Value: $644,000 - $770,000
4
Beds
2
Baths
3,752
Sq Ft
$188/Sq Ft
Est. Value
About This Home
This home is located at 31 Whiting St Unit 31A, Roxbury, MA 02119 and is currently estimated at $706,838, approximately $188 per square foot. 31 Whiting St Unit 31A is a home located in Suffolk County with nearby schools including City on a Hill Charter Public School.
Ownership History
Date
Name
Owned For
Owner Type
Purchase Details
Closed on
Feb 27, 2004
Sold by
Roxbury Dev Corp
Bought by
Harris Lessie V and Harris Patricia
Current Estimated Value
Home Financials for this Owner
Home Financials are based on the most recent Mortgage that was taken out on this home.
Original Mortgage
$150,150
Outstanding Balance
$70,075
Interest Rate
5.65%
Mortgage Type
Purchase Money Mortgage
Estimated Equity
$636,763
Create a Home Valuation Report for This Property
The Home Valuation Report is an in-depth analysis detailing your home's value as well as a comparison with similar homes in the area
Home Values in the Area
Average Home Value in this Area
Purchase History
| Date | Buyer | Sale Price | Title Company |
|---|---|---|---|
| Harris Lessie V | $195,000 | -- |
Source: Public Records
Mortgage History
| Date | Status | Borrower | Loan Amount |
|---|---|---|---|
| Open | Harris Lessie V | $150,150 |
Source: Public Records
Tax History Compared to Growth
Tax History
| Year | Tax Paid | Tax Assessment Tax Assessment Total Assessment is a certain percentage of the fair market value that is determined by local assessors to be the total taxable value of land and additions on the property. | Land | Improvement |
|---|---|---|---|---|
| 2025 | $5,709 | $493,000 | $162,690 | $330,310 |
| 2024 | $5,118 | $469,500 | $126,765 | $342,735 |
| 2023 | $4,802 | $447,100 | $120,717 | $326,383 |
| 2022 | $4,633 | $425,800 | $114,966 | $310,834 |
| 2021 | $4,327 | $405,500 | $0 | $405,500 |
| 2020 | $4,078 | $386,200 | $0 | $386,200 |
| 2019 | $3,877 | $367,800 | $154,300 | $213,500 |
| 2018 | $3,671 | $350,300 | $154,300 | $196,000 |
| 2017 | $3,533 | $333,600 | $154,300 | $179,300 |
| 2016 | $3,495 | $317,700 | $154,300 | $163,400 |
| 2015 | $3,664 | $302,600 | $113,500 | $189,100 |
| 2014 | $3,626 | $288,200 | $113,500 | $174,700 |
Source: Public Records
Map
Nearby Homes
- 20 Rockville Park
- 22 Rockville Park
- 33 Copeland Park Unit C
- 30 Copeland St Unit 1
- 7 Langford Park Unit 3
- 101 Mount Pleasant Ave
- 59 Perrin St
- 59 Perrin St Unit 1
- 108 Mount Pleasant Ave Unit 108R
- 10 Rockland St Unit 4
- 80 Blue Hill Ave Unit 5
- 22 Alaska St
- 37 Regent St Unit 2
- 45 Woodville St
- 119 Blue Hill Ave
- 31 Alaska St
- 2 Mount Pleasant Place Unit 2
- 133 Blue Hill Ave
- 94 Walnut Ave
- Lot 84 Blue Hill Ave
- 29 Whiting St
- 18 Montrose St Unit 20
- 22-22A Montrose St
- 27 Whiting St Unit 27A
- 22 Montrose St Unit 22A
- 22 Montrose St Unit 1
- 22 Montrose St Unit 2
- 39 Whiting St Unit 41
- 32 Whiting St
- 24 Montrose St Unit 1
- 24 Montrose St Unit 2
- 34 Whiting St Unit 1
- 34 Whiting St
- 10 Montrose St
- 36 Whiting St
- 30 Whiting St
- 38 Whiting St
- 38 Whiting St Unit 2
- 43 Whiting St
- 28 Whiting St