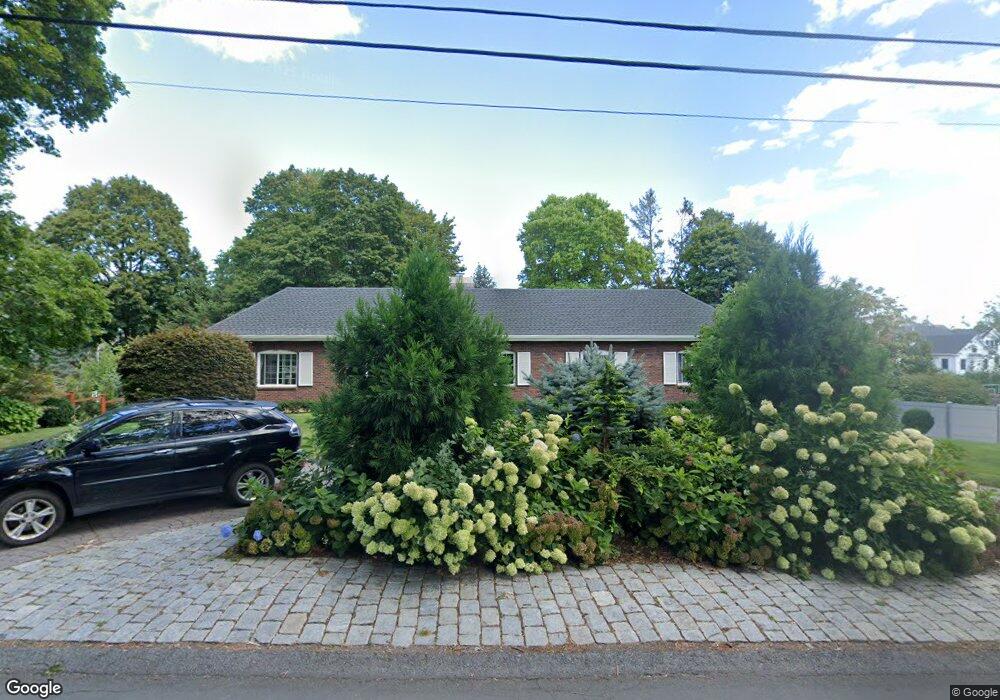
31 Whiton Ave Hingham, MA 02043
Crow Point NeighborhoodEstimated Value: $1,989,000 - $2,938,000
4
Beds
3
Baths
5,111
Sq Ft
$458/Sq Ft
Est. Value
About This Home
This home is located at 31 Whiton Ave, Hingham, MA 02043 and is currently estimated at $2,338,612, approximately $457 per square foot. 31 Whiton Ave is a home located in Plymouth County with nearby schools including William L. Foster Elementary School, Hingham Middle School, and Hingham High School.
Ownership History
Date
Name
Owned For
Owner Type
Purchase Details
Closed on
Jun 30, 2009
Sold by
Murphy Peter J and Murphy Joan M
Bought by
Megard Renaud and Megard Isabelle
Current Estimated Value
Home Financials for this Owner
Home Financials are based on the most recent Mortgage that was taken out on this home.
Original Mortgage
$523,750
Outstanding Balance
$334,993
Interest Rate
4.92%
Mortgage Type
Purchase Money Mortgage
Estimated Equity
$2,003,619
Purchase Details
Closed on
Mar 1, 1999
Sold by
Bach Neil D and Bach Joan E
Bought by
Benson Jacquelyn M and Benson Michael R
Purchase Details
Closed on
Feb 28, 1991
Sold by
Lehan D Joseph and Lehan Ann B
Bought by
Schoell Richard A and Schoell Barbara A
Create a Home Valuation Report for This Property
The Home Valuation Report is an in-depth analysis detailing your home's value as well as a comparison with similar homes in the area
Home Values in the Area
Average Home Value in this Area
Purchase History
| Date | Buyer | Sale Price | Title Company |
|---|---|---|---|
| Megard Renaud | $975,000 | -- | |
| Benson Jacquelyn M | $510,000 | -- | |
| Schoell Richard A | $426,000 | -- |
Source: Public Records
Mortgage History
| Date | Status | Borrower | Loan Amount |
|---|---|---|---|
| Open | Schoell Richard A | $50,000 | |
| Open | Schoell Richard A | $523,750 |
Source: Public Records
Tax History Compared to Growth
Tax History
| Year | Tax Paid | Tax Assessment Tax Assessment Total Assessment is a certain percentage of the fair market value that is determined by local assessors to be the total taxable value of land and additions on the property. | Land | Improvement |
|---|---|---|---|---|
| 2025 | $14,959 | $1,399,300 | $697,200 | $702,100 |
| 2024 | $14,746 | $1,359,100 | $697,200 | $661,900 |
| 2023 | $13,442 | $1,344,200 | $697,200 | $647,000 |
| 2022 | $12,741 | $1,102,200 | $601,100 | $501,100 |
| 2021 | $12,391 | $1,050,100 | $601,100 | $449,000 |
| 2020 | $12,108 | $1,050,100 | $601,100 | $449,000 |
| 2019 | $11,935 | $1,010,600 | $500,900 | $509,700 |
| 2018 | $4,531 | $957,000 | $500,900 | $456,100 |
| 2017 | $11,479 | $937,100 | $500,900 | $436,200 |
| 2016 | $11,407 | $913,300 | $477,100 | $436,200 |
| 2015 | $11,160 | $890,700 | $454,500 | $436,200 |
Source: Public Records
Map
Nearby Homes
- 17 Paige St
- 12 Daley Rd
- 53 Bel Air Rd - To Be Built
- 16 Foley Beach Rd
- 81 Kimball Beach Rd
- 125 Halsted Dr Unit 125
- 132 Hms Stayner Dr Unit 132
- 130 Broad Reach Unit 206
- 51 Broad Reach Unit T23A
- 73 Broad Reach Unit M36C
- 73 Broad Reach Unit M21C
- 246 North St
- 83 North St
- 191 South St
- 300 River St Unit 12
- 225 South St Unit 1
- 112 Martins Ln
- 21 Hersey St
- 10R Martins Ln
- 19 Lantern Ln