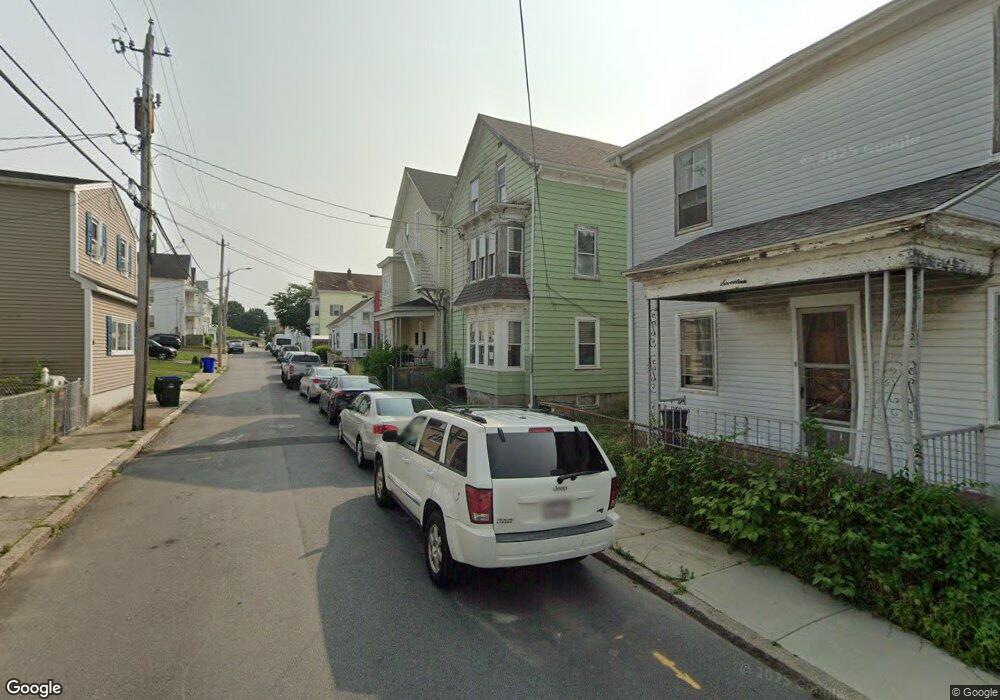
31 Wilcox St Fall River, MA 02724
Father Kelly NeighborhoodEstimated Value: $663,000 - $704,000
9
Beds
3
Baths
2,940
Sq Ft
$233/Sq Ft
Est. Value
About This Home
This home is located at 31 Wilcox St, Fall River, MA 02724 and is currently estimated at $686,000, approximately $233 per square foot. 31 Wilcox St is a home located in Bristol County with nearby schools including Carlton M. Viveiros Elementary School, Matthew J. Kuss Middle School, and B M C Durfee High School.
Ownership History
Date
Name
Owned For
Owner Type
Purchase Details
Closed on
Aug 20, 2021
Sold by
Ozimek J Est and Weber
Bought by
Highland Fncl Protection
Current Estimated Value
Home Financials for this Owner
Home Financials are based on the most recent Mortgage that was taken out on this home.
Original Mortgage
$269,785
Outstanding Balance
$245,318
Interest Rate
2.9%
Mortgage Type
Commercial
Estimated Equity
$440,682
Create a Home Valuation Report for This Property
The Home Valuation Report is an in-depth analysis detailing your home's value as well as a comparison with similar homes in the area
Home Values in the Area
Average Home Value in this Area
Purchase History
| Date | Buyer | Sale Price | Title Company |
|---|---|---|---|
| Highland Fncl Protection | $150,000 | None Available |
Source: Public Records
Mortgage History
| Date | Status | Borrower | Loan Amount |
|---|---|---|---|
| Open | Highland Fncl Protection | $269,785 |
Source: Public Records
Tax History
| Year | Tax Paid | Tax Assessment Tax Assessment Total Assessment is a certain percentage of the fair market value that is determined by local assessors to be the total taxable value of land and additions on the property. | Land | Improvement |
|---|---|---|---|---|
| 2025 | $5,752 | $502,400 | $107,300 | $395,100 |
| 2024 | $5,515 | $480,000 | $103,300 | $376,700 |
| 2023 | $4,782 | $389,700 | $85,400 | $304,300 |
| 2022 | $3,903 | $309,300 | $81,300 | $228,000 |
| 2021 | $3,708 | $268,100 | $77,400 | $190,700 |
| 2020 | $3,361 | $232,600 | $76,200 | $156,400 |
| 2019 | $2,899 | $198,800 | $73,400 | $125,400 |
| 2018 | $2,820 | $192,900 | $79,500 | $113,400 |
| 2017 | $2,649 | $189,200 | $75,800 | $113,400 |
| 2016 | $2,607 | $191,300 | $80,600 | $110,700 |
| 2015 | $2,506 | $191,600 | $80,600 | $111,000 |
| 2014 | $2,507 | $199,300 | $78,300 | $121,000 |
Source: Public Records
Map
Nearby Homes
- 20 Wilcox St
- 1334 S Main St
- 1273-1279 S Main St
- 234 Kilburn St
- 917 Dwelly St
- 464 Birch St
- 344-354 E Main St
- 1846 S Main St
- 609 King Philip St
- 1852 S Main St
- 219 Montaup St
- 71 Mystic St Unit 3
- 240 Montaup St
- 70 Brown St
- 82 Montaup St
- 57 Larouche St
- 15 Higgins St
- 340 Vale St
- 355 Peckham St
- 221 Beach St
Your Personal Tour Guide
Ask me questions while you tour the home.