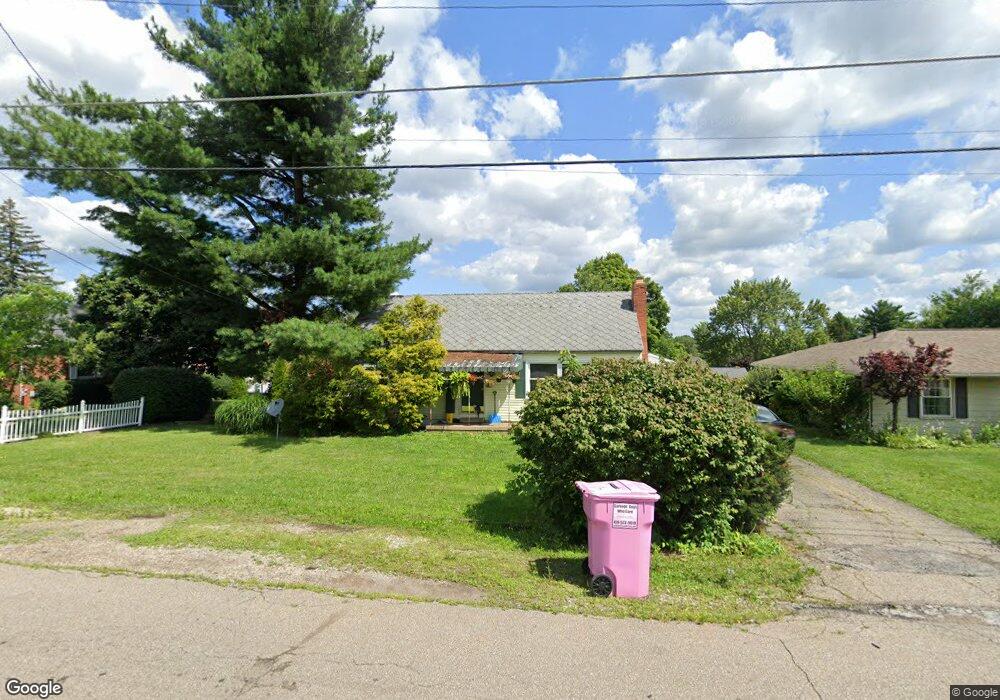
31 Winchester Rd Mansfield, OH 44907
Estimated Value: $135,000 - $151,741
4
Beds
1
Bath
1,123
Sq Ft
$128/Sq Ft
Est. Value
About This Home
This home is located at 31 Winchester Rd, Mansfield, OH 44907 and is currently estimated at $144,185, approximately $128 per square foot. 31 Winchester Rd is a home located in Richland County with nearby schools including Madison High School, St. Peter's Elementary/Montessori School, and St. Peter's High School/Junior High.
Ownership History
Date
Name
Owned For
Owner Type
Purchase Details
Closed on
Aug 16, 2010
Sold by
Fannie Mae
Bought by
Norman Joshua B and Norman Christy C
Current Estimated Value
Home Financials for this Owner
Home Financials are based on the most recent Mortgage that was taken out on this home.
Original Mortgage
$20,250
Interest Rate
7.5%
Mortgage Type
New Conventional
Purchase Details
Closed on
Jan 13, 2010
Sold by
Arter Ryan M
Bought by
Federal National Mortgage Association
Purchase Details
Closed on
Aug 21, 2002
Sold by
Montanya David B
Bought by
Arter Ryan M
Home Financials for this Owner
Home Financials are based on the most recent Mortgage that was taken out on this home.
Original Mortgage
$59,500
Interest Rate
6.63%
Mortgage Type
New Conventional
Purchase Details
Closed on
Oct 4, 1996
Sold by
Wilson David M
Bought by
Montanya David B and Montanya Amy D
Home Financials for this Owner
Home Financials are based on the most recent Mortgage that was taken out on this home.
Original Mortgage
$63,050
Interest Rate
8%
Mortgage Type
New Conventional
Purchase Details
Closed on
Sep 1, 1985
Create a Home Valuation Report for This Property
The Home Valuation Report is an in-depth analysis detailing your home's value as well as a comparison with similar homes in the area
Home Values in the Area
Average Home Value in this Area
Purchase History
| Date | Buyer | Sale Price | Title Company |
|---|---|---|---|
| Norman Joshua B | $27,000 | None Available | |
| Federal National Mortgage Association | $63,914 | None Available | |
| Arter Ryan M | $76,000 | -- | |
| Montanya David B | $66,400 | -- | |
| -- | $41,000 | -- |
Source: Public Records
Mortgage History
| Date | Status | Borrower | Loan Amount |
|---|---|---|---|
| Closed | Norman Joshua B | $20,250 | |
| Previous Owner | Arter Ryan M | $59,500 | |
| Previous Owner | Montanya David B | $63,050 |
Source: Public Records
Tax History Compared to Growth
Tax History
| Year | Tax Paid | Tax Assessment Tax Assessment Total Assessment is a certain percentage of the fair market value that is determined by local assessors to be the total taxable value of land and additions on the property. | Land | Improvement |
|---|---|---|---|---|
| 2024 | $1,512 | $37,420 | $6,250 | $31,170 |
| 2023 | $1,512 | $37,420 | $6,250 | $31,170 |
| 2022 | $1,177 | $26,890 | $5,200 | $21,690 |
| 2021 | $1,177 | $26,890 | $5,200 | $21,690 |
| 2020 | $1,188 | $26,890 | $5,200 | $21,690 |
| 2019 | $1,125 | $22,980 | $4,400 | $18,580 |
| 2018 | $1,114 | $22,980 | $4,400 | $18,580 |
| 2017 | $1,091 | $22,980 | $4,400 | $18,580 |
| 2016 | $1,082 | $22,250 | $4,180 | $18,070 |
| 2015 | $1,062 | $22,250 | $4,180 | $18,070 |
| 2014 | $1,058 | $22,250 | $4,180 | $18,070 |
| 2012 | $522 | $23,430 | $4,400 | $19,030 |
Source: Public Records
Map
Nearby Homes
- 61 Ridgewood Blvd
- 138 Cliffbrook Dr
- 33 Rambleside Dr
- 681 Hillgrove Ave
- 674 Hillgrove Ave
- 189 Kinkel Ave
- 237 Willowbrook Dr
- 844 Woodville Rd
- 292 Greenlee Rd
- 223 Reform St
- 181 Chilton Ave
- 607 Woodville Rd
- 490 Rembrandt St
- 69 Reba Ave
- 430 Beethoven St
- 405 Plainview Ave
- 136 Elmridge Rd
- 0 S Main St
- 394 S Main St
- 519 S Diamond St
- 37 Winchester Rd
- 27 Winchester Rd
- 0 Winchester Rd Unit 30 Richland
- 32 Brentwood Rd
- 38 Brentwood Rd
- 28 Brentwood Rd
- 46 Brentwood Rd
- 41 Winchester Rd
- 819 S Main St
- 24 Brentwood Rd
- 0 Winchester Rd 22 Richland Unit 7138542-11767677
- 0 Winchester Rd 22 Richland Unit 7138542-11614493
- 0 Winchester Rd 22 Richland Unit 7138542-11614509
- 0 Winchester Rd 22 Richland Unit 7138542-10964216
- 0 Winchester Rd 30 Richland Unit 6200319-11828787
- 0 Winchester Rd 30 Richland Unit 6200319-9136419
- 0 Winchester Rd 30 Richland Unit 6200319-10871847
- 54 Brentwood Rd
- 837 S Main St
- 30 Winchester Rd