31 Woodward St Worcester, MA 01610
Main South NeighborhoodEstimated Value: $332,000 - $394,000
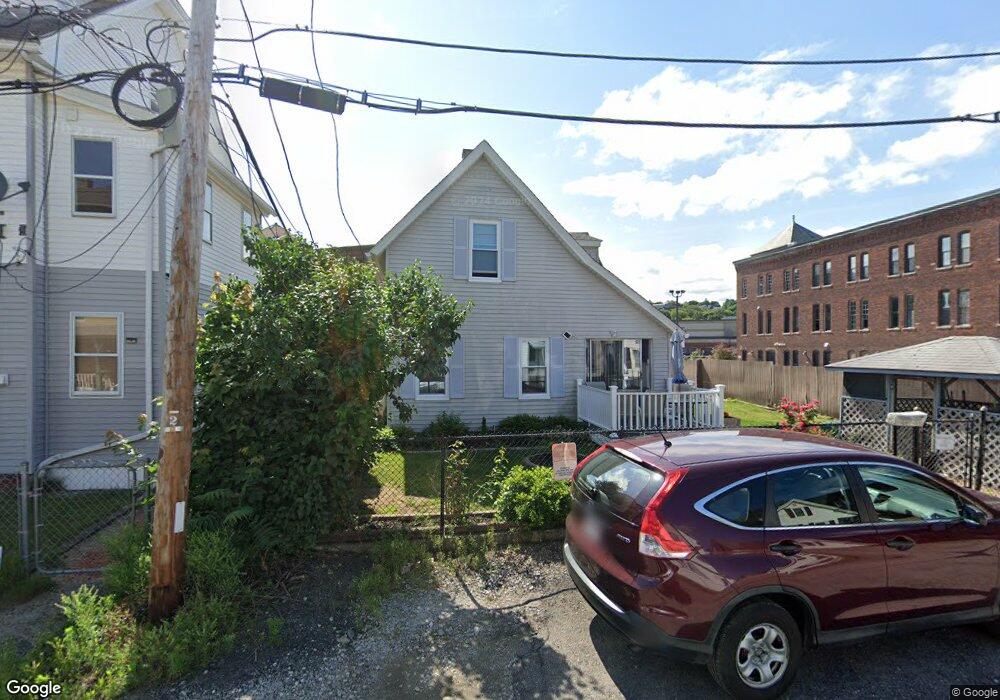
About This Home
This home is located at 31 Woodward St, Worcester, MA 01610 and is currently estimated at $354,047, approximately $322 per square foot. 31 Woodward St is a home located in Worcester County with nearby schools including Jacob Hiatt Magnet School, Chandler Magnet, and University Park Campus School.
Ownership History
We collect this data history from publicly available records. To have your information removed, we recommend requesting removal directly through your county’s website.
Purchase Details
Purchase Details
Home Values in the Area
Average Home Value in this Area
Purchase History
We collect this data history from publicly available records. To have your information removed, we recommend requesting removal directly through your county’s website.
| Date | Buyer | Sale Price | Title Company |
|---|---|---|---|
| $204,000 | -- | ||
| $57,000 | -- |
Mortgage History
We collect this data history from publicly available records. To have your information removed, we recommend requesting removal directly through your county’s website.
| Date | Status | Borrower | Loan Amount |
|---|---|---|---|
| Previous Owner | $224,166 | ||
| Previous Owner | $97,000 | ||
| Previous Owner | $80,800 |
Tax History
We collect this data history from publicly available records. To have your information removed, we recommend requesting removal directly through your county’s website.
| Year | Tax Paid | Tax Assessment Tax Assessment Total Assessment is a certain percentage of the fair market value that is determined by local assessors to be the total taxable value of land and additions on the property. | Land | Improvement |
|---|---|---|---|---|
| 2025 | $3,822 | $289,800 | $68,800 | $221,000 |
| 2024 | $3,630 | $264,000 | $68,800 | $195,200 |
| 2023 | $3,505 | $244,400 | $59,800 | $184,600 |
| 2022 | $3,249 | $213,600 | $47,800 | $165,800 |
| 2021 | $3,111 | $191,100 | $38,300 | $152,800 |
| 2020 | $2,934 | $172,600 | $38,000 | $134,600 |
| 2019 | $2,801 | $155,600 | $33,200 | $122,400 |
| 2018 | $2,782 | $147,100 | $33,200 | $113,900 |
| 2017 | $2,635 | $137,100 | $33,200 | $103,900 |
| 2016 | $2,667 | $129,400 | $24,500 | $104,900 |
| 2015 | $2,597 | $129,400 | $24,500 | $104,900 |
| 2014 | $2,528 | $129,400 | $24,500 | $104,900 |
Map
- 407 Cambridge St Unit B7
- 3 Chelsea St
- 14-14 1/2 Hacker St
- 8 Douglas St
- 155 Grand St
- 549 Cambridge St
- 21 Illinois St Unit 202
- 160 Fremont St Unit 105
- 160 Fremont St Unit 317
- 160 Fremont St Unit 213
- 160 Fremont St Unit 310
- 54 Richards St
- 54 Freeland St
- 27 Malvern Rd
- 23 Wyman St
- 200 Beacon St
- 5 Ripley Place
- 3A Gediminas St
- 605 Millbury St
- 6 Epworth St
- 31 Crompton St
- 32 Woodward St
- 2 Pakachoag St
- 29 Crompton St
- 27 Crompton St
- 30 Woodward St
- 28 Woodward St
- 26 Woodward St
- 25 1/2 Crompton St
- 1 Pakachoag St
- 34 Woodward St
- 28 Crompton St
- 25 Crompton St
- 21 Woodward St
- 26 Crompton St
- 23 Crompton St
- 23 Crompton St Unit 1
- 24 Crompton St
- 22 Crompton St
- 22 Crompton St Unit 3
Ask me questions while you tour the home.