Estimated Value: $342,334 - $385,000
3
Beds
2
Baths
1,804
Sq Ft
$198/Sq Ft
Est. Value
About This Home
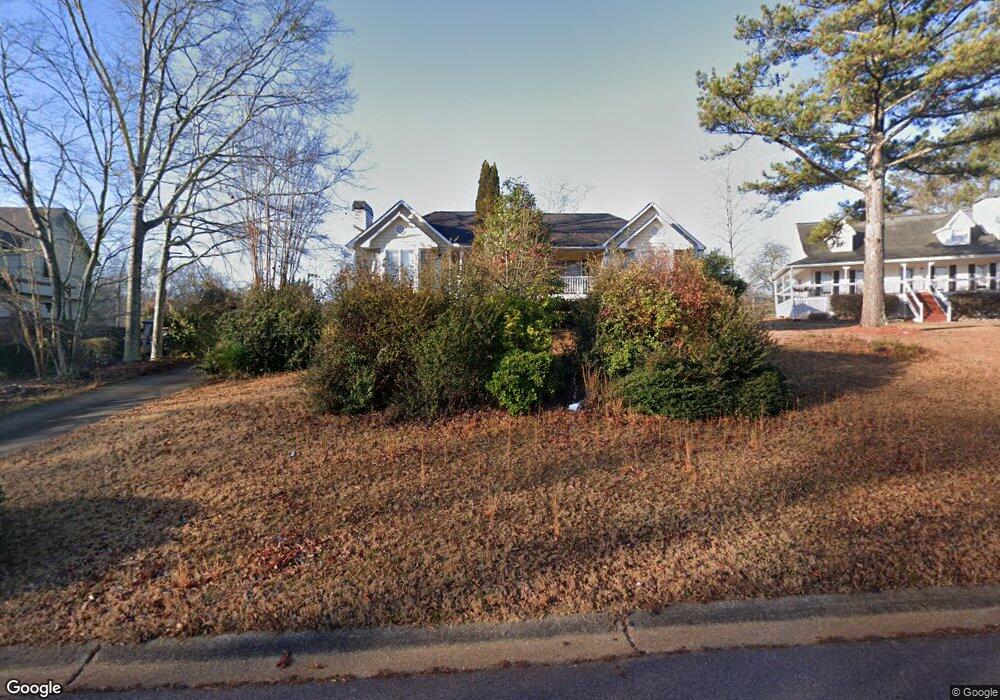
This home is located at 31 Wren Walk, Hiram, GA 30141 and is currently estimated at $357,584, approximately $198 per square foot. 31 Wren Walk is a home located in Paulding County with nearby schools including Hal Hutchens Elementary School, Irma C. Austin Middle School, and Hiram High School.
Ownership History
Date
Name
Owned For
Owner Type
Purchase Details
Closed on
Jan 31, 2005
Sold by
Smith Smith D and Smith Dorothy
Bought by
Copeland James E
Current Estimated Value
Home Financials for this Owner
Home Financials are based on the most recent Mortgage that was taken out on this home.
Original Mortgage
$151,050
Outstanding Balance
$76,473
Interest Rate
5.69%
Mortgage Type
VA
Estimated Equity
$281,111
Purchase Details
Closed on
Mar 5, 1997
Sold by
Lunsford Robert Ellen
Bought by
Owens Sidney Leigh
Create a Home Valuation Report for This Property
The Home Valuation Report is an in-depth analysis detailing your home's value as well as a comparison with similar homes in the area
Home Values in the Area
Average Home Value in this Area
Purchase History
| Date | Buyer | Sale Price | Title Company |
|---|---|---|---|
| Copeland James E | $147,900 | -- | |
| Owens Sidney Leigh | $96,500 | -- |
Source: Public Records
Mortgage History
| Date | Status | Borrower | Loan Amount |
|---|---|---|---|
| Open | Copeland James E | $151,050 | |
| Closed | Owens Sidney Leigh | $0 |
Source: Public Records
Tax History Compared to Growth
Tax History
| Year | Tax Paid | Tax Assessment Tax Assessment Total Assessment is a certain percentage of the fair market value that is determined by local assessors to be the total taxable value of land and additions on the property. | Land | Improvement |
|---|---|---|---|---|
| 2024 | $1,002 | $147,764 | $12,000 | $135,764 |
| 2023 | $2,184 | $135,104 | $12,000 | $123,104 |
| 2022 | $1,298 | $82,584 | $7,648 | $74,936 |
| 2021 | $1,491 | $82,584 | $7,648 | $74,936 |
| 2020 | $1,541 | $82,584 | $10,000 | $72,584 |
| 2019 | $1,848 | $63,200 | $7,535 | $55,665 |
| 2018 | $1,848 | $63,200 | $7,535 | $55,665 |
| 2017 | $1,993 | $67,116 | $8,000 | $59,116 |
| 2016 | $1,698 | $58,028 | $8,000 | $50,028 |
| 2015 | $1,539 | $51,848 | $8,000 | $43,848 |
| 2014 | $1,490 | $49,052 | $8,000 | $41,052 |
| 2013 | -- | $33,760 | $8,000 | $25,760 |
Source: Public Records
Map
Nearby Homes