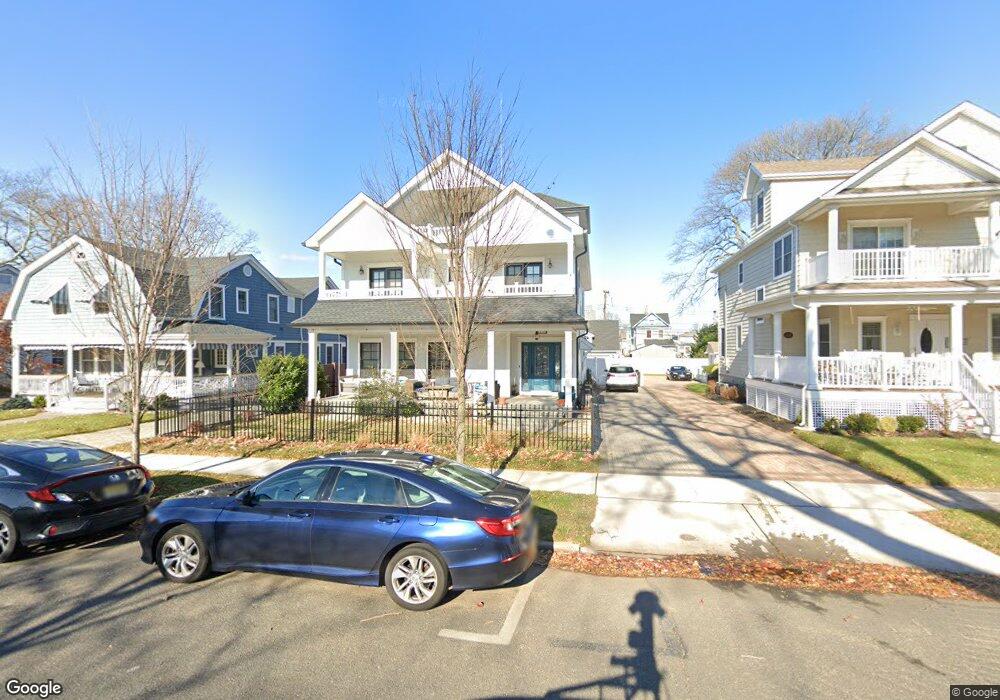
310 10th Ave Unit Main House Belmar, NJ 07719
Estimated Value: $1,924,000 - $2,386,000
6
Beds
3
Baths
3,762
Sq Ft
$568/Sq Ft
Est. Value
About This Home
This home is located at 310 10th Ave Unit Main House, Belmar, NJ 07719 and is currently estimated at $2,136,006, approximately $567 per square foot. 310 10th Ave Unit Main House is a home located in Monmouth County with nearby schools including Belmar Elementary School, St. Rose Grammar School, and St Rose High School.
Ownership History
Date
Name
Owned For
Owner Type
Purchase Details
Closed on
Jun 21, 2017
Sold by
Luckasavage Mark
Bought by
Carchesio Dianne and Luckasavage Mark
Current Estimated Value
Home Financials for this Owner
Home Financials are based on the most recent Mortgage that was taken out on this home.
Interest Rate
3.91%
Purchase Details
Closed on
May 19, 2016
Sold by
Luckasavage Mark
Bought by
Luckasavage Mark
Purchase Details
Closed on
Mar 30, 2015
Sold by
Kirby Katherine L and Murtha Frank
Bought by
Luckasavage Mark
Home Financials for this Owner
Home Financials are based on the most recent Mortgage that was taken out on this home.
Original Mortgage
$512,000
Interest Rate
2.87%
Mortgage Type
Adjustable Rate Mortgage/ARM
Create a Home Valuation Report for This Property
The Home Valuation Report is an in-depth analysis detailing your home's value as well as a comparison with similar homes in the area
Home Values in the Area
Average Home Value in this Area
Purchase History
| Date | Buyer | Sale Price | Title Company |
|---|---|---|---|
| Carchesio Dianne | -- | -- | |
| Luckasavage Mark | -- | Attorney | |
| Luckasavage Mark | $640,000 | None Available |
Source: Public Records
Mortgage History
| Date | Status | Borrower | Loan Amount |
|---|---|---|---|
| Closed | Carchesio Dianne | -- | |
| Previous Owner | Luckasavage Mark | $512,000 |
Source: Public Records
Tax History Compared to Growth
Tax History
| Year | Tax Paid | Tax Assessment Tax Assessment Total Assessment is a certain percentage of the fair market value that is determined by local assessors to be the total taxable value of land and additions on the property. | Land | Improvement |
|---|---|---|---|---|
| 2025 | $15,621 | $1,073,600 | $500,000 | $573,600 |
| 2024 | $15,095 | $1,073,600 | $500,000 | $573,600 |
| 2023 | $15,095 | $1,073,600 | $500,000 | $573,600 |
| 2022 | $14,569 | $1,073,600 | $500,000 | $573,600 |
| 2021 | $14,569 | $1,073,600 | $500,000 | $573,600 |
| 2020 | $14,440 | $1,073,600 | $500,000 | $573,600 |
| 2019 | $6,725 | $500,000 | $500,000 | $0 |
| 2018 | $6,175 | $500,000 | $500,000 | $0 |
| 2017 | $8,834 | $733,100 | $500,000 | $233,100 |
| 2016 | $8,210 | $429,600 | $205,000 | $224,600 |
| 2015 | $8,532 | $444,600 | $220,000 | $224,600 |
| 2014 | $12,409 | $641,300 | $200,000 | $441,300 |
Source: Public Records
Map
Nearby Homes