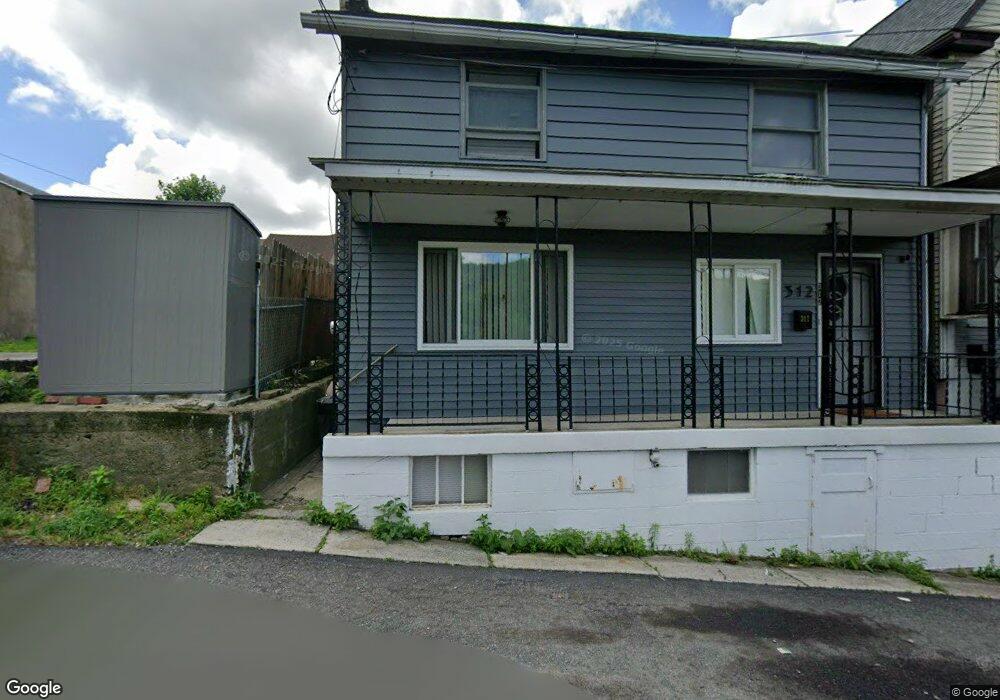
310-312 W Snyder Ave Lansford, PA 18232
Estimated Value: $77,000 - $118,000
4
Beds
1
Bath
1,638
Sq Ft
$56/Sq Ft
Est. Value
About This Home
This home is located at 310-312 W Snyder Ave, Lansford, PA 18232 and is currently estimated at $92,508, approximately $56 per square foot. 310-312 W Snyder Ave is a home located in Carbon County with nearby schools including Panther Valley Intermediate School, Panther Valley Elementary School, and Panther Valley Junior/Senior High School.
Ownership History
Date
Name
Owned For
Owner Type
Purchase Details
Closed on
Jul 29, 2021
Sold by
Rvfm 13 Series Llc
Bought by
Santana Felix
Current Estimated Value
Purchase Details
Closed on
May 23, 2017
Sold by
Wells Fargo Bank National Association
Bought by
Rvfm 13 Series Llc
Purchase Details
Closed on
Jan 27, 2016
Sold by
Aaron Acquisitions Llc and Fisher Donna M
Bought by
Wells Fargo Bank
Purchase Details
Closed on
Jan 4, 2007
Sold by
Aaron Associates Llc
Bought by
Aaron Acquisitions Llc
Purchase Details
Closed on
May 25, 2006
Sold by
Barlow Kristina
Bought by
Aaron Associates Llc
Home Financials for this Owner
Home Financials are based on the most recent Mortgage that was taken out on this home.
Original Mortgage
$20,000
Interest Rate
6.62%
Mortgage Type
Purchase Money Mortgage
Create a Home Valuation Report for This Property
The Home Valuation Report is an in-depth analysis detailing your home's value as well as a comparison with similar homes in the area
Home Values in the Area
Average Home Value in this Area
Purchase History
| Date | Buyer | Sale Price | Title Company |
|---|---|---|---|
| Santana Felix | $15,900 | Settlement Usa Inc | |
| Rvfm 13 Series Llc | $8,005 | None Available | |
| Wells Fargo Bank | $1,046 | None Available | |
| Aaron Acquisitions Llc | $36,579 | None Available | |
| Aaron Associates Llc | $22,000 | None Available |
Source: Public Records
Mortgage History
| Date | Status | Borrower | Loan Amount |
|---|---|---|---|
| Previous Owner | Aaron Associates Llc | $20,000 |
Source: Public Records
Tax History Compared to Growth
Tax History
| Year | Tax Paid | Tax Assessment Tax Assessment Total Assessment is a certain percentage of the fair market value that is determined by local assessors to be the total taxable value of land and additions on the property. | Land | Improvement |
|---|---|---|---|---|
| 2025 | $1,453 | $13,350 | $4,050 | $9,300 |
| 2024 | $1,527 | $13,350 | $4,050 | $9,300 |
| 2023 | $1,517 | $13,350 | $4,050 | $9,300 |
| 2022 | $1,529 | $13,350 | $4,050 | $9,300 |
| 2021 | $1,529 | $13,350 | $4,050 | $9,300 |
| 2020 | $1,506 | $13,350 | $4,050 | $9,300 |
| 2019 | $1,432 | $13,350 | $4,050 | $9,300 |
| 2018 | $1,419 | $13,350 | $4,050 | $9,300 |
| 2017 | $1,401 | $13,350 | $4,050 | $9,300 |
| 2016 | -- | $13,350 | $4,050 | $9,300 |
| 2015 | -- | $13,350 | $4,050 | $9,300 |
| 2014 | -- | $13,350 | $4,050 | $9,300 |
Source: Public Records
Map
Nearby Homes
- 312 W Ridge St
- 335 W Patterson St
- 303 W Patterson St
- 239 W Bertsch St
- 16 Center St
- 343 W Kline Ave
- 306 W Kline Ave
- 206 W Bertsch St
- 228 W Abbott St
- 25 W Ridge St
- 9 Tunnel St
- 28 E Snyder Ave
- 40 Springgarden St
- 217 E Ridge St
- 221 E Patterson St
- 231-233 E Ridge St
- 265-267 E Bertsch St
- 260 E Abbott St
- 308 E Snyder Ave
- 307 E Abbott St
- 314 W Snyder Ave
- 318 W Snyder Ave
- Godshall W Snyder Ave
- 310 W Snyder Ave Unit 312
- 310-312 312 W Snyder Ave
- 320 W Snyder Ave
- 327 W Ridge St
- 319 W Ridge St
- 312 W Snyder Ave
- 325 W Ridge St
- 317 W Ridge St
- 329 W Ridge St
- 321 W Ridge St
- 331 W Ridge St
- 313 W Ridge St
- 315 W Ridge St
- 336 W Snyder Ave
- 308 W Front St
- 310 W Front St
- 306 W Front St