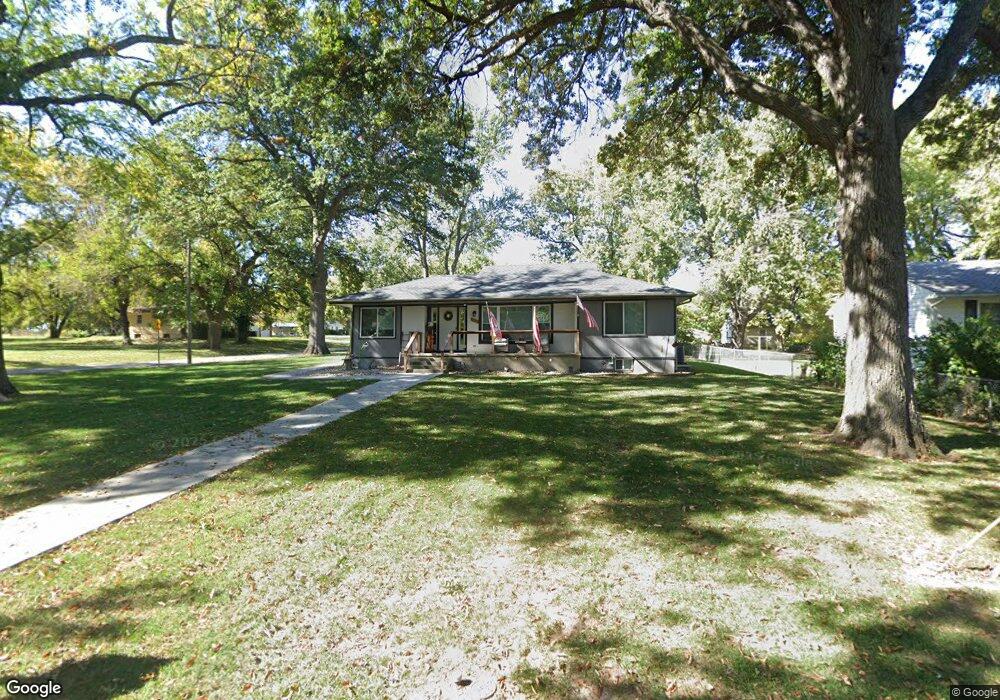
310 5th Ave S Greenwood, MO 64034
Estimated Value: $273,000 - $401,000
4
Beds
4
Baths
1,612
Sq Ft
$192/Sq Ft
Est. Value
About This Home
This home is located at 310 5th Ave S, Greenwood, MO 64034 and is currently estimated at $308,966, approximately $191 per square foot. 310 5th Ave S is a home located in Jackson County with nearby schools including Greenwood Elementary School, Summit Lakes Middle School, and Lee's Summit West High School.
Ownership History
Date
Name
Owned For
Owner Type
Purchase Details
Closed on
Jun 11, 2019
Sold by
Allen Debra A and Allen Danny W
Bought by
Mosley Derk Alvin
Current Estimated Value
Home Financials for this Owner
Home Financials are based on the most recent Mortgage that was taken out on this home.
Original Mortgage
$180,500
Outstanding Balance
$159,022
Interest Rate
4.2%
Mortgage Type
New Conventional
Estimated Equity
$149,944
Purchase Details
Closed on
Jun 25, 2001
Sold by
Beasley T Don and Beasley Doris E
Bought by
Allen Danny W and Allen Debra A
Home Financials for this Owner
Home Financials are based on the most recent Mortgage that was taken out on this home.
Original Mortgage
$103,700
Interest Rate
7.08%
Mortgage Type
Purchase Money Mortgage
Purchase Details
Closed on
Aug 13, 1998
Sold by
Don Beasley T and Don Doris E
Bought by
Beasley Doris E and Beasley Don T
Create a Home Valuation Report for This Property
The Home Valuation Report is an in-depth analysis detailing your home's value as well as a comparison with similar homes in the area
Home Values in the Area
Average Home Value in this Area
Purchase History
| Date | Buyer | Sale Price | Title Company |
|---|---|---|---|
| Mosley Derk Alvin | -- | None Available | |
| Allen Danny W | -- | Coffelt Land Title | |
| Beasley Doris E | -- | -- |
Source: Public Records
Mortgage History
| Date | Status | Borrower | Loan Amount |
|---|---|---|---|
| Open | Mosley Derk Alvin | $180,500 | |
| Previous Owner | Allen Danny W | $103,700 |
Source: Public Records
Tax History Compared to Growth
Tax History
| Year | Tax Paid | Tax Assessment Tax Assessment Total Assessment is a certain percentage of the fair market value that is determined by local assessors to be the total taxable value of land and additions on the property. | Land | Improvement |
|---|---|---|---|---|
| 2025 | $2,543 | $36,686 | $5,744 | $30,942 |
| 2024 | $2,517 | $36,782 | $4,940 | $31,842 |
| 2023 | $2,517 | $36,782 | $3,110 | $33,672 |
| 2022 | $2,156 | $27,740 | $5,035 | $22,705 |
| 2021 | $2,206 | $27,740 | $5,035 | $22,705 |
| 2020 | $2,132 | $26,380 | $5,035 | $21,345 |
| 2019 | $2,095 | $26,380 | $5,035 | $21,345 |
| 2018 | $2,160 | $25,179 | $3,682 | $21,497 |
| 2017 | $2,160 | $25,179 | $3,682 | $21,497 |
| 2016 | $2,161 | $24,548 | $3,629 | $20,919 |
| 2014 | $2,256 | $25,035 | $3,211 | $21,824 |
Source: Public Records
Map
Nearby Homes
- 202 6th Ave S
- 1106 Huntington Ln
- 1107 Huntington Ln
- 1210 Huntington Ln
- 1301 Meadows Ln
- 701 16th Ave S
- 403 Ridgeway Dr
- 405 17th Ave S
- 704 16th Ave S
- 105 17th Ave S
- 1113 Hummingbird Ct
- 810 Tabitha Ln
- 1505 Rolling Dr
- 1306 Dogwood Dr
- 1104 16th Ave S
- 1208 Bradford Dr
- 1803 Brent Ln
- 1900 Blackfoot Ct
- 202 20th Ave S
- 1011 Wilds Pkwy
- 306 5th Ave S
- 309 5th Ave S
- 307 S No Address Assigned By City Ave S
- 309 5th St S
- 305 5th Ave S
- 501 Oak St W
- 302 5th Ave S
- 508 Oak St W
- 409 Oak St W
- 409 Chestnut St
- 509 Oak St W
- 307 5th Ave S
- 307 6th Ave S
- 507 Chestnut St
- 402 Oak St W
- 206 5th Ave S
- 401 Oak St W
- 401 Chestnut St
- 508 Chestnut St
- 105 6th Ave S