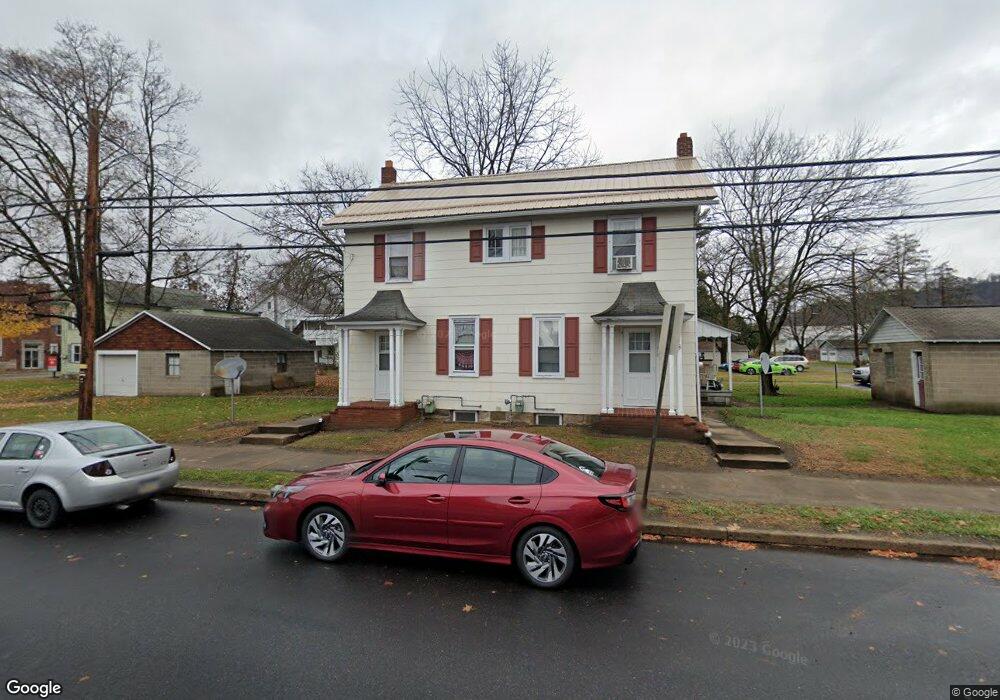
310 Broad St Nescopeck, PA 18635
Estimated Value: $133,989 - $254,000
--
Bed
--
Bath
2,048
Sq Ft
$104/Sq Ft
Est. Value
About This Home
This home is located at 310 Broad St, Nescopeck, PA 18635 and is currently estimated at $213,747, approximately $104 per square foot. 310 Broad St is a home with nearby schools including Berwick Area High School.
Ownership History
Date
Name
Owned For
Owner Type
Purchase Details
Closed on
Jun 17, 2021
Sold by
Powlus Richari L and Powlus Hope H
Bought by
Jrs Property Management Llc
Current Estimated Value
Home Financials for this Owner
Home Financials are based on the most recent Mortgage that was taken out on this home.
Original Mortgage
$117,500
Outstanding Balance
$106,382
Interest Rate
2.9%
Mortgage Type
Future Advance Clause Open End Mortgage
Estimated Equity
$107,365
Purchase Details
Closed on
May 12, 2021
Sold by
Powlus Richard L and Powlus Hope H
Bought by
Nescopeck Borough Of
Home Financials for this Owner
Home Financials are based on the most recent Mortgage that was taken out on this home.
Original Mortgage
$117,500
Outstanding Balance
$106,382
Interest Rate
2.9%
Mortgage Type
Future Advance Clause Open End Mortgage
Estimated Equity
$107,365
Purchase Details
Closed on
Jul 16, 2013
Sold by
Powlus Richard L and Powlus Hope H
Bought by
Powlus Richard L and Powlus Hope H
Create a Home Valuation Report for This Property
The Home Valuation Report is an in-depth analysis detailing your home's value as well as a comparison with similar homes in the area
Home Values in the Area
Average Home Value in this Area
Purchase History
| Date | Buyer | Sale Price | Title Company |
|---|---|---|---|
| Jrs Property Management Llc | $132,500 | None Available | |
| Nescopeck Borough Of | -- | Accommodation | |
| Powlus Richard L | -- | None Available |
Source: Public Records
Mortgage History
| Date | Status | Borrower | Loan Amount |
|---|---|---|---|
| Open | Jrs Property Management Llc | $117,500 |
Source: Public Records
Tax History Compared to Growth
Tax History
| Year | Tax Paid | Tax Assessment Tax Assessment Total Assessment is a certain percentage of the fair market value that is determined by local assessors to be the total taxable value of land and additions on the property. | Land | Improvement |
|---|---|---|---|---|
| 2025 | $1,328 | $59,100 | $19,200 | $39,900 |
| 2024 | $1,288 | $59,100 | $19,200 | $39,900 |
| 2023 | $1,237 | $59,100 | $19,200 | $39,900 |
| 2022 | $1,226 | $59,100 | $19,200 | $39,900 |
| 2021 | $1,175 | $61,400 | $21,500 | $39,900 |
| 2020 | $1,140 | $61,400 | $21,500 | $39,900 |
| 2019 | $1,131 | $61,400 | $21,500 | $39,900 |
| 2018 | $1,123 | $61,400 | $21,500 | $39,900 |
| 2017 | $1,168 | $61,400 | $21,500 | $39,900 |
| 2016 | -- | $61,400 | $21,500 | $39,900 |
| 2015 | -- | $61,400 | $21,500 | $39,900 |
| 2014 | -- | $61,400 | $21,500 | $39,900 |
Source: Public Records
Map
Nearby Homes