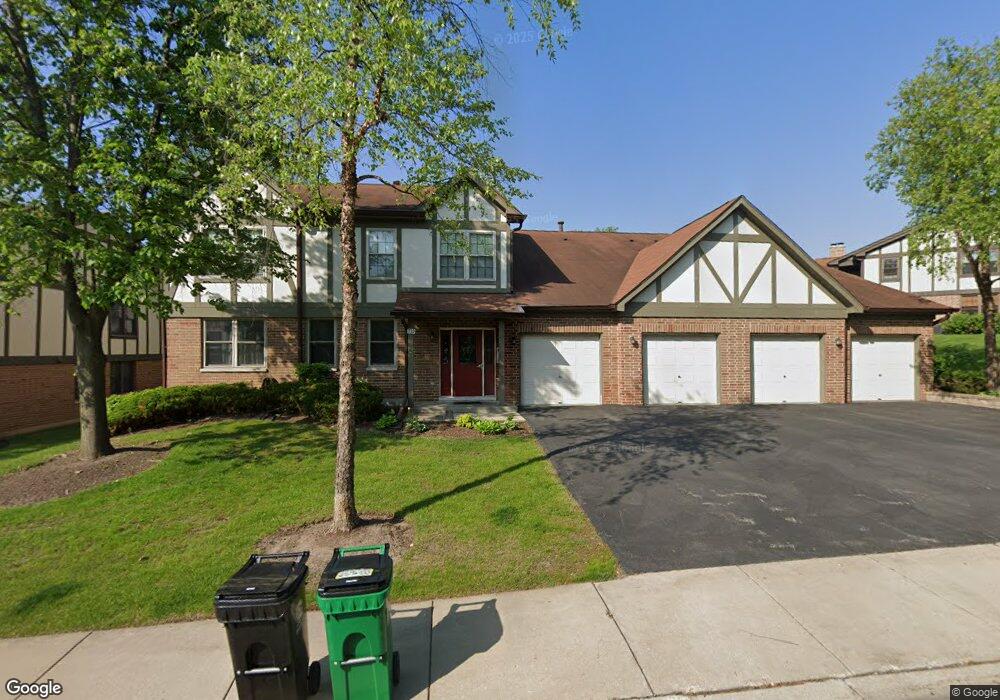
310 Carriage Way Unit B Bloomingdale, IL 60108
Estimated Value: $245,000 - $271,000
2
Beds
2
Baths
1,276
Sq Ft
$205/Sq Ft
Est. Value
About This Home
This home is located at 310 Carriage Way Unit B, Bloomingdale, IL 60108 and is currently estimated at $261,000, approximately $204 per square foot. 310 Carriage Way Unit B is a home located in DuPage County with nearby schools including Marquardt Middle School, Glenbard East High School, and St Matthew School.
Ownership History
Date
Name
Owned For
Owner Type
Purchase Details
Closed on
May 12, 2017
Sold by
Bayview Loan Servicing Llc
Bought by
Isom Harry A and Isom Jennifer L
Current Estimated Value
Home Financials for this Owner
Home Financials are based on the most recent Mortgage that was taken out on this home.
Original Mortgage
$125,910
Outstanding Balance
$104,652
Interest Rate
4.08%
Mortgage Type
New Conventional
Estimated Equity
$156,348
Purchase Details
Closed on
Jan 22, 2015
Sold by
Decore Joseph A
Bought by
Bayview Loan Servicing Llc
Purchase Details
Closed on
Jan 3, 2008
Sold by
Simek Doris
Bought by
Decore Joseph A
Home Financials for this Owner
Home Financials are based on the most recent Mortgage that was taken out on this home.
Original Mortgage
$185,095
Interest Rate
5.95%
Mortgage Type
FHA
Create a Home Valuation Report for This Property
The Home Valuation Report is an in-depth analysis detailing your home's value as well as a comparison with similar homes in the area
Home Values in the Area
Average Home Value in this Area
Purchase History
| Date | Buyer | Sale Price | Title Company |
|---|---|---|---|
| Isom Harry A | $140,000 | None Available | |
| Bayview Loan Servicing Llc | -- | None Available | |
| Decore Joseph A | $188,000 | Atg |
Source: Public Records
Mortgage History
| Date | Status | Borrower | Loan Amount |
|---|---|---|---|
| Open | Isom Harry A | $125,910 | |
| Previous Owner | Decore Joseph A | $185,095 |
Source: Public Records
Tax History Compared to Growth
Tax History
| Year | Tax Paid | Tax Assessment Tax Assessment Total Assessment is a certain percentage of the fair market value that is determined by local assessors to be the total taxable value of land and additions on the property. | Land | Improvement |
|---|---|---|---|---|
| 2024 | $4,647 | $59,770 | $15,582 | $44,188 |
| 2023 | $4,316 | $54,660 | $14,250 | $40,410 |
| 2022 | $4,327 | $50,620 | $14,160 | $36,460 |
| 2021 | $4,223 | $48,090 | $13,450 | $34,640 |
| 2020 | $3,982 | $46,910 | $13,120 | $33,790 |
| 2019 | $3,807 | $45,080 | $12,610 | $32,470 |
| 2018 | $4,465 | $48,660 | $12,280 | $36,380 |
| 2017 | $4,214 | $45,100 | $11,380 | $33,720 |
| 2016 | $3,975 | $41,740 | $10,530 | $31,210 |
| 2015 | $3,870 | $38,950 | $9,830 | $29,120 |
| 2014 | $3,427 | $34,900 | $5,780 | $29,120 |
| 2013 | $3,478 | $36,100 | $5,980 | $30,120 |
Source: Public Records
Map
Nearby Homes
- 316 Juliana Ln
- 358 Mayo Ln
- 310 Terry Ln
- 4N310 Walter Rd
- 316 Morningside Dr Unit A
- 300 Starling Ct Unit A
- 224 Oakwood Ln
- 205 Emerson Ct Unit B
- 253 Sterling Ln
- 158 S Prairie Ave
- 319 Indiana Ct Unit D
- 881 N Swift Rd Unit 106
- 259 Cunningham Ln
- 2155 College Dr Unit 7
- 2158 College Dr Unit 7
- 865 N Tamarac Blvd
- 802 N Tamarac Blvd Unit Z5
- 120 Lakeview Dr Unit 513
- 120 Lakeview Dr Unit 318
- 264 Winston Ln
- 310 Carriage Way Unit 2C
- 310 Carriage Way Unit 1A
- 310 Carriage Way Unit 1B
- 316 Carriage Way Unit 1B
- 316 Carriage Way Unit 1A
- 316 Carriage Way Unit 2D
- 316 Carriage Way Unit 2C
- 310 Carriage Way Unit 2D
- 316 Carriage Way Unit D
- 208 Stoneybrook Ln Unit 2082C
- 208 Stoneybrook Ln Unit 2D
- 208 Stoneybrook Ln Unit 1B
- 208 Stoneybrook Ln Unit 1A
- 315 Carriage Way
- 313 Carriage Way
- 311 Carriage Way
- 306 Carriage Way Unit 2C
- 306 Carriage Way Unit 2D
- 306 Carriage Way Unit 1A
- 306 Carriage Way Unit 1B