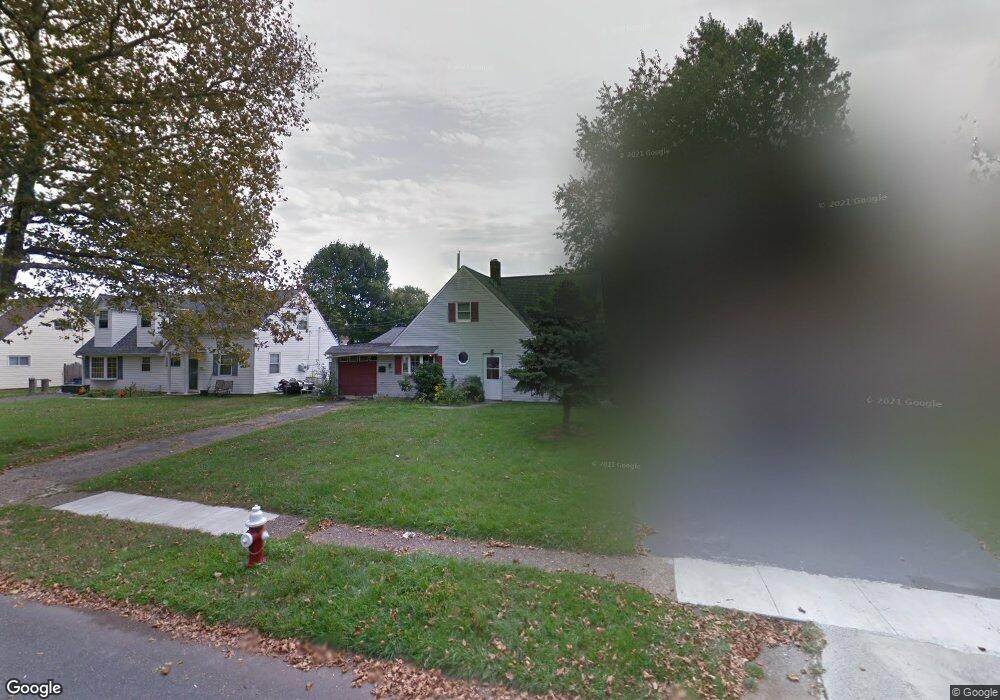
310 Crabtree Dr Levittown, PA 19055
Crabtree Hollow NeighborhoodEstimated Value: $331,000 - $397,000
4
Beds
1
Bath
1,576
Sq Ft
$236/Sq Ft
Est. Value
About This Home
This home is located at 310 Crabtree Dr, Levittown, PA 19055 and is currently estimated at $372,283, approximately $236 per square foot. 310 Crabtree Dr is a home located in Bucks County with nearby schools including Truman Senior High School, Hope Lutheran School, and Emilie Christian Day School.
Ownership History
Date
Name
Owned For
Owner Type
Purchase Details
Closed on
Sep 27, 2018
Sold by
Thomas Virgil E and Thomas Chantel M
Bought by
Mascia Larry and Mascia Margaret
Current Estimated Value
Home Financials for this Owner
Home Financials are based on the most recent Mortgage that was taken out on this home.
Original Mortgage
$20,000
Outstanding Balance
$17,441
Interest Rate
4.5%
Mortgage Type
Future Advance Clause Open End Mortgage
Estimated Equity
$354,842
Purchase Details
Closed on
Oct 14, 1994
Sold by
Look Gail M
Bought by
Thomas Virgil E and Thomas Chantel M
Home Financials for this Owner
Home Financials are based on the most recent Mortgage that was taken out on this home.
Original Mortgage
$90,000
Interest Rate
8.49%
Purchase Details
Closed on
Aug 2, 1989
Bought by
Look Gail M
Create a Home Valuation Report for This Property
The Home Valuation Report is an in-depth analysis detailing your home's value as well as a comparison with similar homes in the area
Home Values in the Area
Average Home Value in this Area
Purchase History
| Date | Buyer | Sale Price | Title Company |
|---|---|---|---|
| Mascia Larry | $95,000 | Alpert Abstracrt Llc | |
| Thomas Virgil E | $100,000 | Lawyers Title Insurance Corp | |
| Look Gail M | $91,400 | -- |
Source: Public Records
Mortgage History
| Date | Status | Borrower | Loan Amount |
|---|---|---|---|
| Open | Mascia Larry | $20,000 | |
| Previous Owner | Thomas Virgil E | $90,000 |
Source: Public Records
Tax History Compared to Growth
Tax History
| Year | Tax Paid | Tax Assessment Tax Assessment Total Assessment is a certain percentage of the fair market value that is determined by local assessors to be the total taxable value of land and additions on the property. | Land | Improvement |
|---|---|---|---|---|
| 2025 | $4,345 | $16,000 | $3,960 | $12,040 |
| 2024 | $4,345 | $16,000 | $3,960 | $12,040 |
| 2023 | $4,313 | $16,000 | $3,960 | $12,040 |
| 2022 | $4,313 | $16,000 | $3,960 | $12,040 |
| 2021 | $4,313 | $16,000 | $3,960 | $12,040 |
| 2020 | $4,313 | $16,000 | $3,960 | $12,040 |
| 2019 | $4,297 | $16,000 | $3,960 | $12,040 |
| 2018 | $4,228 | $16,000 | $3,960 | $12,040 |
| 2017 | $4,164 | $16,000 | $3,960 | $12,040 |
| 2016 | $4,164 | $16,000 | $3,960 | $12,040 |
| 2015 | $2,955 | $16,000 | $3,960 | $12,040 |
| 2014 | $2,955 | $16,000 | $3,960 | $12,040 |
Source: Public Records
Map
Nearby Homes