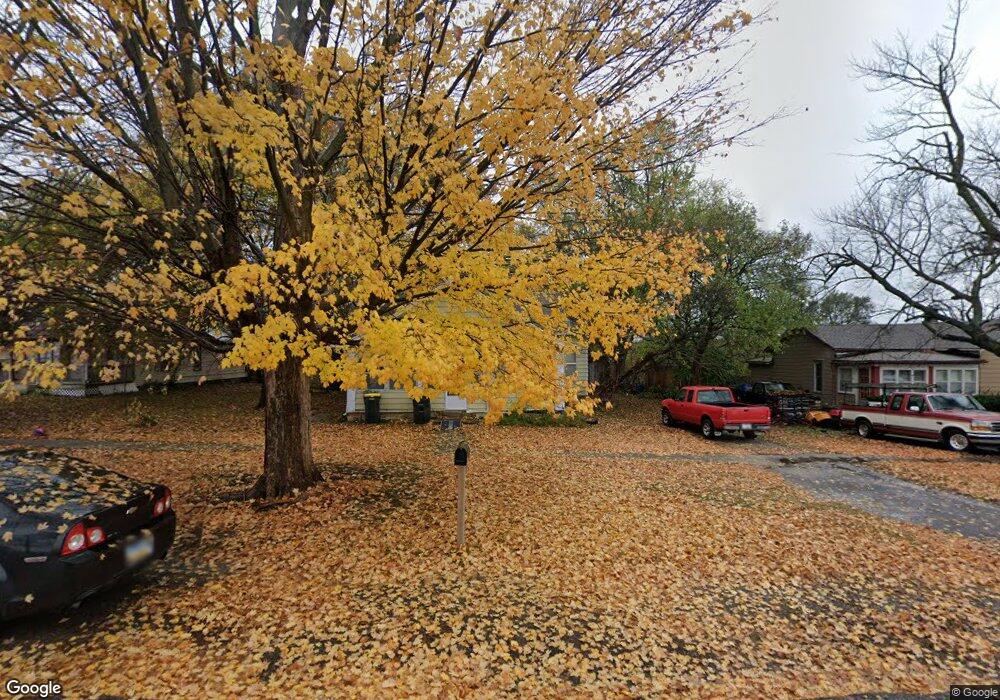
310 E Kansas St Lansing, KS 66043
Estimated Value: $206,000 - $209,000
2
Beds
1
Bath
1,366
Sq Ft
$152/Sq Ft
Est. Value
About This Home
This home is located at 310 E Kansas St, Lansing, KS 66043 and is currently estimated at $207,403, approximately $151 per square foot. 310 E Kansas St is a home located in Leavenworth County with nearby schools including Lansing Elementary School, Lansing Middle 6-8, and Lansing High 9-12.
Ownership History
Date
Name
Owned For
Owner Type
Purchase Details
Closed on
Jan 2, 2026
Sold by
Caught Looking Properties Llc
Bought by
Birdsong Dawn and Mantooth Dawn
Current Estimated Value
Home Financials for this Owner
Home Financials are based on the most recent Mortgage that was taken out on this home.
Original Mortgage
$90,000
Outstanding Balance
$89,915
Interest Rate
6.26%
Mortgage Type
New Conventional
Estimated Equity
$117,488
Purchase Details
Closed on
Feb 26, 2025
Sold by
Rees Patrick L
Bought by
Caught Looking Properties Llc
Purchase Details
Closed on
Oct 2, 2024
Sold by
Graef Family Living Trust and Graef Calvin R
Bought by
Rees Patrick L
Purchase Details
Closed on
Aug 28, 2008
Sold by
Rees Gladys E
Bought by
Rees Patrick L and Rees Gladys E
Create a Home Valuation Report for This Property
The Home Valuation Report is an in-depth analysis detailing your home's value as well as a comparison with similar homes in the area
Home Values in the Area
Average Home Value in this Area
Purchase History
We collect this data history from publicly available records. To have your information removed, we recommend requesting removal directly through your county’s website.
| Date | Buyer | Sale Price | Title Company |
|---|---|---|---|
| Birdsong Dawn | -- | Security Land | |
| Caught Looking Properties Llc | -- | Security Land Title Agency | |
| Rees Patrick L | -- | None Listed On Document | |
| Rees Patrick L | -- | -- |
Source: Public Records
Mortgage History
We collect this data history from publicly available records. To have your information removed, we recommend requesting removal directly through your county’s website.
| Date | Status | Borrower | Loan Amount |
|---|---|---|---|
| Open | Birdsong Dawn | $90,000 |
Source: Public Records
Tax History
| Year | Tax Paid | Tax Assessment Tax Assessment Total Assessment is a certain percentage of the fair market value that is determined by local assessors to be the total taxable value of land and additions on the property. | Land | Improvement |
|---|---|---|---|---|
| 2025 | $1,627 | $14,470 | $2,544 | $11,926 |
| 2024 | $1,627 | $13,523 | $2,544 | $10,979 |
| 2023 | $1,627 | $13,003 | $2,418 | $10,585 |
| 2022 | $1,435 | $11,820 | $2,157 | $9,663 |
| 2021 | $1,435 | $10,177 | $2,157 | $8,020 |
| 2020 | $1,345 | $9,408 | $2,157 | $7,251 |
| 2019 | $1,347 | $9,408 | $2,157 | $7,251 |
| 2018 | $1,193 | $8,370 | $2,157 | $6,213 |
| 2017 | $1,070 | $7,524 | $2,157 | $5,367 |
| 2016 | $1,060 | $7,449 | $2,157 | $5,292 |
| 2015 | $1,152 | $8,093 | $2,157 | $5,936 |
| 2014 | $1,151 | $8,257 | $2,157 | $6,100 |
Source: Public Records
Map
Nearby Homes
- 313 E Kay St
- 134 S 3rd Ct
- 124 S Main St
- 202 S Main St
- 112 W Kay St
- 237 Fairlane St
- 828 S Valley Dr
- 20958 Ida St
- 00000 Brookwood St
- 412 Fairlane St
- 321 Holiday Dr
- 964 N Hwy 5 N A
- 1100 N 4th St
- 1102 N 4th St
- 139 Woodland Rd
- 361 Ash Ln
- 602 E Eisenhower Rd
- 1102 N Main St
- 114 Ethel Ln
- 601 E Eisenhower Rd
Your Personal Tour Guide
Ask me questions while you tour the home.