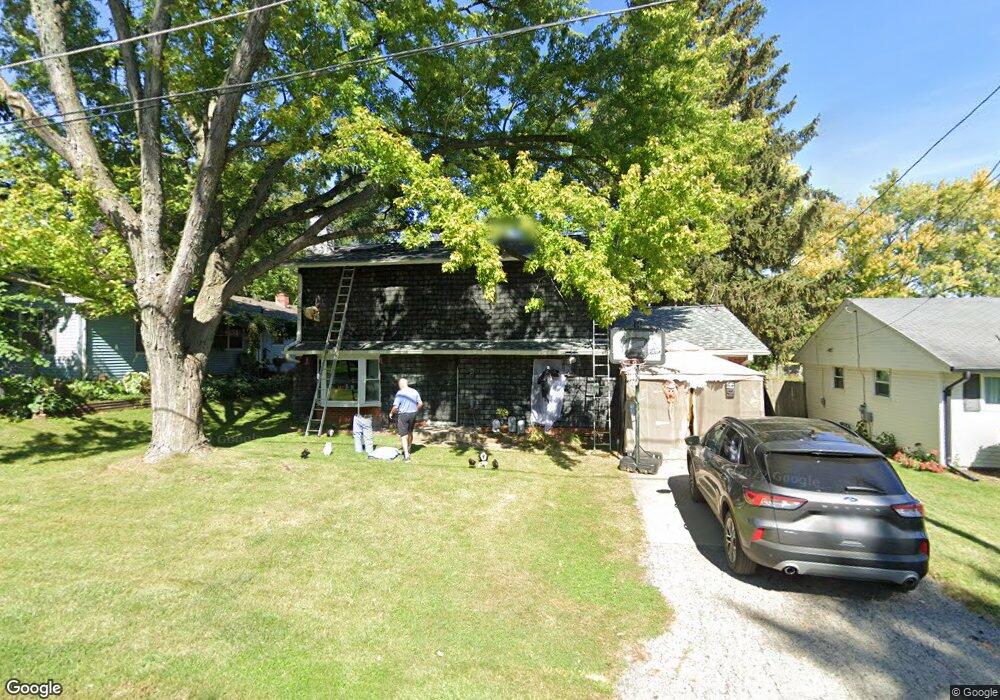
310 E Reader St Elburn, IL 60119
Estimated Value: $234,160 - $355,000
Studio
--
Bath
--
Sq Ft
8,189
Sq Ft Lot
About This Home
This home is located at 310 E Reader St, Elburn, IL 60119 and is currently estimated at $302,040. 310 E Reader St is a home located in Kane County with nearby schools including Kaneland John Stewart Elementary School, Harter Middle School, and Kaneland High School.
Ownership History
Date
Name
Owned For
Owner Type
Purchase Details
Closed on
Jul 18, 2016
Sold by
Beavan Rachel C and Wawrzynice Gregory
Bought by
Beavan Peter J
Current Estimated Value
Home Financials for this Owner
Home Financials are based on the most recent Mortgage that was taken out on this home.
Original Mortgage
$136,000
Interest Rate
4.62%
Mortgage Type
New Conventional
Purchase Details
Closed on
Feb 16, 2005
Sold by
Beavan Jodi L
Bought by
Beavan Peter J and Beavan Rachel C
Home Financials for this Owner
Home Financials are based on the most recent Mortgage that was taken out on this home.
Original Mortgage
$125,000
Interest Rate
5.64%
Mortgage Type
New Conventional
Purchase Details
Closed on
Sep 14, 1999
Sold by
Beavan Peter J and Beavan Jodi L
Bought by
Beavan Peter J and Beavan Jodi L
Create a Home Valuation Report for This Property
The Home Valuation Report is an in-depth analysis detailing your home's value as well as a comparison with similar homes in the area
Home Values in the Area
Average Home Value in this Area
Purchase History
| Date | Buyer | Sale Price | Title Company |
|---|---|---|---|
| Beavan Peter J | -- | Associates Title Inc | |
| Beavan Peter J | -- | Ticor Title Insurance Co | |
| Beavan Peter J | -- | -- |
Source: Public Records
Mortgage History
| Date | Status | Borrower | Loan Amount |
|---|---|---|---|
| Closed | Beavan Peter J | $136,000 | |
| Closed | Beavan Peter J | $125,000 |
Source: Public Records
Tax History
| Year | Tax Paid | Tax Assessment Tax Assessment Total Assessment is a certain percentage of the fair market value that is determined by local assessors to be the total taxable value of land and additions on the property. | Land | Improvement |
|---|---|---|---|---|
| 2024 | $4,245 | $73,518 | $9,745 | $63,773 |
| 2023 | $4,569 | $66,352 | $8,795 | $57,557 |
| 2022 | $4,781 | $57,075 | $8,072 | $49,003 |
| 2021 | $4,614 | $54,628 | $7,726 | $46,902 |
| 2020 | $4,528 | $53,348 | $7,545 | $45,803 |
| 2019 | $4,527 | $52,565 | $7,434 | $45,131 |
| 2018 | $3,381 | $40,065 | $7,434 | $32,631 |
| 2017 | $3,378 | $39,609 | $7,349 | $32,260 |
| 2016 | $3,034 | $35,301 | $7,155 | $28,146 |
| 2015 | -- | $34,380 | $6,876 | $27,504 |
| 2014 | -- | $33,098 | $7,651 | $25,447 |
| 2013 | -- | $33,098 | $7,651 | $25,447 |
Source: Public Records
Map
Nearby Homes
- 526 N Main St
- 620 Ridge Dr
- 410 W Reader St
- 820 N 1st St Unit 820
- 411 S 1st St
- Lot 77 Houtz Cir
- 644 Houtz Cir
- 1085 Station Blvd
- 875 Station Blvd
- 608 Hoyt Dr
- 425 Cambridge Ave
- 540 Parkside Dr
- 000 Illinois 47
- 230 Whitney Dr
- 607 Virginia St
- 634 Virginia St
- 713 Elizabeth St
- 645 Virginia St
- 815 Kindberg Ct
- 1029 Wise St
Your Personal Tour Guide
Ask me questions while you tour the home.