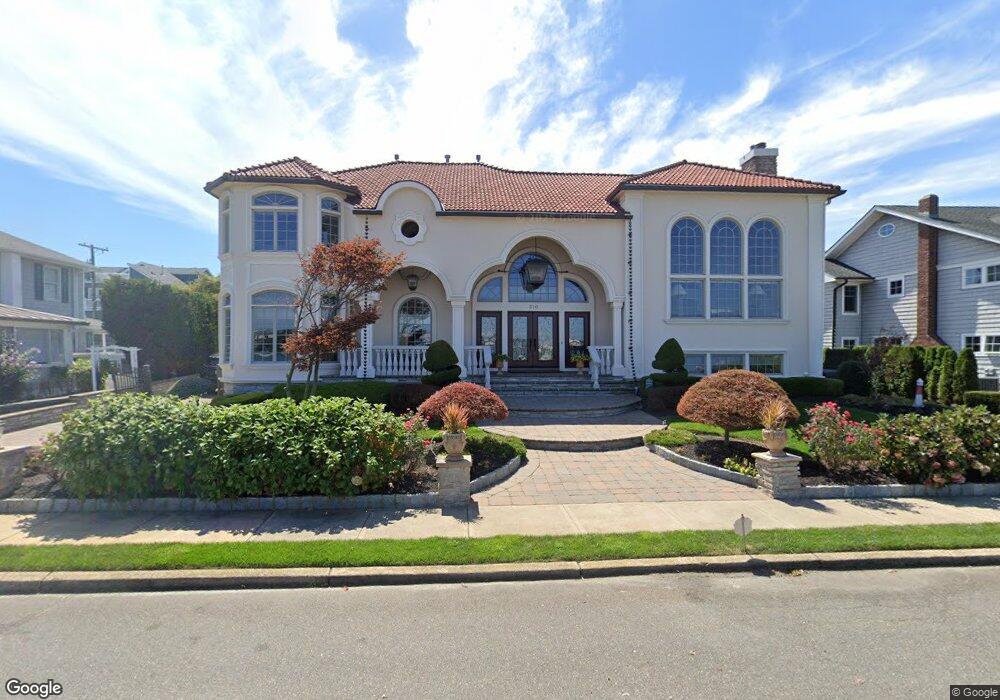
310 Elizabeth Ave Point Pleasant Beach, NJ 08742
Point Pleasant Beach NeighborhoodEstimated Value: $2,745,395 - $3,827,000
4
Beds
5
Baths
4,900
Sq Ft
$675/Sq Ft
Est. Value
About This Home
This home is located at 310 Elizabeth Ave, Point Pleasant Beach, NJ 08742 and is currently estimated at $3,309,599, approximately $675 per square foot. 310 Elizabeth Ave is a home located in Ocean County with nearby schools including G Harold Antrim Elementary School, Point Pleasant Beach High School, and St. Peter School.
Ownership History
Date
Name
Owned For
Owner Type
Purchase Details
Closed on
Oct 24, 2014
Sold by
Rinaldi Frank
Bought by
Reffler Richard C and Reffler Mary T
Current Estimated Value
Home Financials for this Owner
Home Financials are based on the most recent Mortgage that was taken out on this home.
Original Mortgage
$1,200,000
Outstanding Balance
$885,644
Interest Rate
3.12%
Mortgage Type
Adjustable Rate Mortgage/ARM
Estimated Equity
$2,423,955
Purchase Details
Closed on
Aug 25, 2005
Sold by
Rinaldi Rosanna
Bought by
Rinaldi Frank
Home Financials for this Owner
Home Financials are based on the most recent Mortgage that was taken out on this home.
Original Mortgage
$700,000
Interest Rate
5.79%
Mortgage Type
Fannie Mae Freddie Mac
Create a Home Valuation Report for This Property
The Home Valuation Report is an in-depth analysis detailing your home's value as well as a comparison with similar homes in the area
Home Values in the Area
Average Home Value in this Area
Purchase History
| Date | Buyer | Sale Price | Title Company |
|---|---|---|---|
| Reffler Richard C | $1,550,000 | None Available | |
| Rinaldi Frank | -- | Red Bank Title Agency Inc | |
| Rinaldi Frank | $1,300,000 | Red Bank Title Agency Inc |
Source: Public Records
Mortgage History
| Date | Status | Borrower | Loan Amount |
|---|---|---|---|
| Open | Reffler Richard C | $1,200,000 | |
| Previous Owner | Rinaldi Frank | $700,000 |
Source: Public Records
Tax History Compared to Growth
Tax History
| Year | Tax Paid | Tax Assessment Tax Assessment Total Assessment is a certain percentage of the fair market value that is determined by local assessors to be the total taxable value of land and additions on the property. | Land | Improvement |
|---|---|---|---|---|
| 2025 | $21,879 | $1,273,500 | $637,200 | $636,300 |
| 2024 | $21,217 | $1,273,500 | $637,200 | $636,300 |
| 2023 | $20,618 | $1,273,500 | $637,200 | $636,300 |
| 2022 | $20,618 | $1,273,500 | $637,200 | $636,300 |
| 2021 | $20,160 | $1,273,500 | $637,200 | $636,300 |
| 2020 | $20,134 | $1,273,500 | $637,200 | $636,300 |
| 2019 | $19,854 | $1,273,500 | $637,200 | $636,300 |
| 2018 | $19,548 | $1,273,500 | $637,200 | $636,300 |
| 2017 | $19,243 | $1,273,500 | $637,200 | $636,300 |
| 2016 | $19,332 | $1,273,500 | $637,200 | $636,300 |
| 2015 | $19,179 | $1,273,500 | $637,200 | $636,300 |
| 2014 | $19,090 | $1,273,500 | $637,200 | $636,300 |
Source: Public Records
Map
Nearby Homes
- 308 Carter Ave
- 1604 Lake Ave
- 1611 Ocean Ave N
- 1615 Ocean Ave
- 320 Maryland Ave Unit 12G
- 1801 Route 35 Unit 11
- 106 Makin Ave
- 310 Maryland Ave Unit 24
- 1322 Ocean Ave
- 88 Osborne Ave
- 313 Washington Ave
- 1216 Wilmington St
- 118 New York Ave
- 1008 Ocean Ave N
- 340 Main Ave
- 900 Ocean Ave Unit 16
- 503 Atlantic Ave
- 2 Cedar Dr
- 201 Forman Ave
- 110 Trenton Ave
- 314 Elizabeth Ave
- 308 Elizabeth Ave
- 316 Elizabeth Ave
- 313 Carter Ave
- 311 Carter Ave
- 315 Carter Ave
- 306 Elizabeth Ave
- 309 Carter Ave
- 317 Carter Ave
- 318 Elizabeth Ave
- 307 Carter Ave
- 304 Elizabeth Ave
- 319 Carter Ave
- 320 Elizabeth Ave
- 305 Carter Ave
- 321 Carter Ave
- 302 Elizabeth Ave
- 322 Elizabeth Ave
- 312 Carter Ave
- 303 Carter Ave