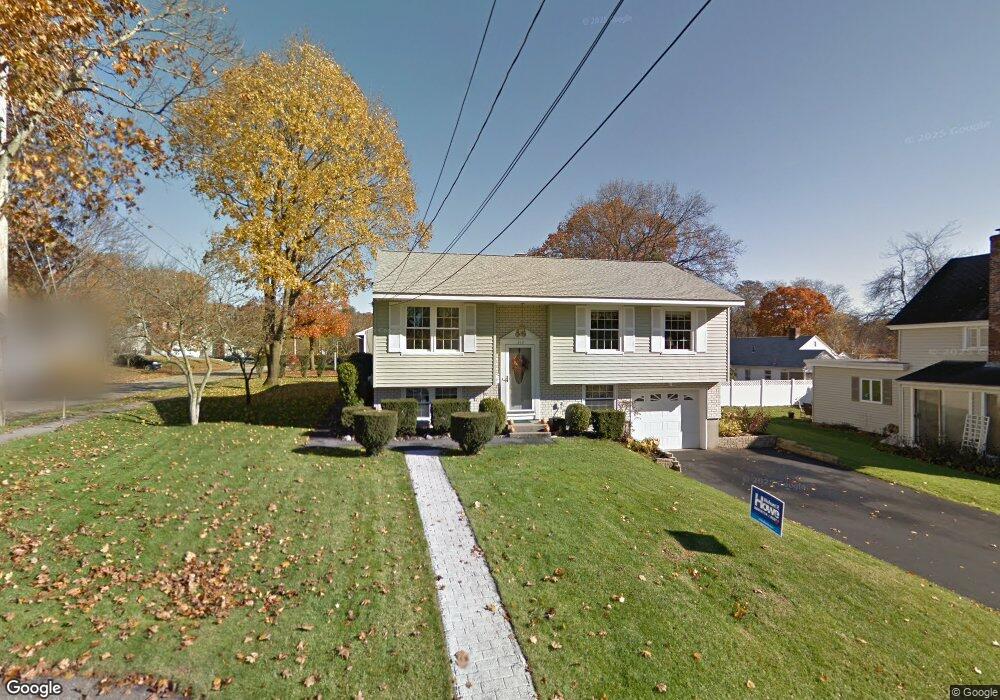
310 Fairmount St Lowell, MA 01852
Belvidere NeighborhoodEstimated Value: $533,000 - $592,000
2
Beds
1
Bath
1,404
Sq Ft
$407/Sq Ft
Est. Value
About This Home
This home is located at 310 Fairmount St, Lowell, MA 01852 and is currently estimated at $572,118, approximately $407 per square foot. 310 Fairmount St is a home located in Middlesex County with nearby schools including Moody Elementary School, Abraham Lincoln Elementary School, and Greenhalge Elementary School.
Ownership History
Date
Name
Owned For
Owner Type
Purchase Details
Closed on
Feb 18, 2025
Sold by
Jb & K Ware Ft and Ware
Bought by
Barry & Karen Ft and Ware
Current Estimated Value
Purchase Details
Closed on
Feb 13, 2020
Sold by
Ware J Barry J and Ware Karen A
Bought by
Jb & K Ware Ft and Ware
Purchase Details
Closed on
Aug 18, 1975
Bought by
Ware J Barry and Ware Karen A
Create a Home Valuation Report for This Property
The Home Valuation Report is an in-depth analysis detailing your home's value as well as a comparison with similar homes in the area
Home Values in the Area
Average Home Value in this Area
Purchase History
| Date | Buyer | Sale Price | Title Company |
|---|---|---|---|
| Barry & Karen Ft | -- | None Available | |
| Barry & Karen Ft | -- | None Available | |
| Jb & K Ware Ft | -- | None Available | |
| Jb & K Ware Ft | -- | None Available | |
| Ware J Barry | -- | -- |
Source: Public Records
Tax History
| Year | Tax Paid | Tax Assessment Tax Assessment Total Assessment is a certain percentage of the fair market value that is determined by local assessors to be the total taxable value of land and additions on the property. | Land | Improvement |
|---|---|---|---|---|
| 2025 | $6,237 | $543,300 | $241,500 | $301,800 |
| 2024 | $6,217 | $522,000 | $225,700 | $296,300 |
| 2023 | $5,960 | $479,900 | $196,200 | $283,700 |
| 2022 | $5,462 | $430,400 | $178,400 | $252,000 |
| 2021 | $5,054 | $375,500 | $155,200 | $220,300 |
| 2020 | $4,824 | $361,100 | $155,200 | $205,900 |
| 2019 | $5,161 | $367,600 | $154,300 | $213,300 |
| 2018 | $4,845 | $336,700 | $146,900 | $189,800 |
| 2017 | $4,752 | $318,500 | $136,400 | $182,100 |
| 2016 | $4,484 | $295,800 | $125,500 | $170,300 |
| 2015 | $4,438 | $286,700 | $125,500 | $161,200 |
| 2013 | $4,060 | $270,500 | $138,400 | $132,100 |
Source: Public Records
Map
Nearby Homes
- 471 Butman Rd
- 317 Nesmith St
- 313 Nesmith St
- 200 Rogers St Unit 6
- 44 Hanks St
- 234 Nesmith St Unit 8
- 42 Pentucket Ave
- 810 Lawrence St Unit C
- 900 Lawrence St Unit 5
- 1204 Lawrence St
- 5 Lenox St Unit 2
- 5 Lenox St Unit 4
- 21 Agawam St
- 14 Warnock St
- 31 Merrill St
- 158 Concord St
- 36 Crowley St
- 88 Perry St
- 251 Clark Rd
- 74 Felton St Unit A
- 316 Fairmount St
- 318 Fairmount St
- 12 Birch St
- 15 Claudine Dr
- 320 Fairmount St
- 290 Fairmount St
- 305 Fairmount St
- 20 Claudine Dr
- 311 Fairmount St
- 297 Fairmount St
- 319 Fairmount St
- 328 Fairmount St
- 284 Fairmount St
- 25 Claudine Dr
- 11 Birch St
- 28 Birch St
- 327 Fairmount St
- 287 Fairmount St
- 334 Fairmount St
- 30 Claudine Dr
Your Personal Tour Guide
Ask me questions while you tour the home.