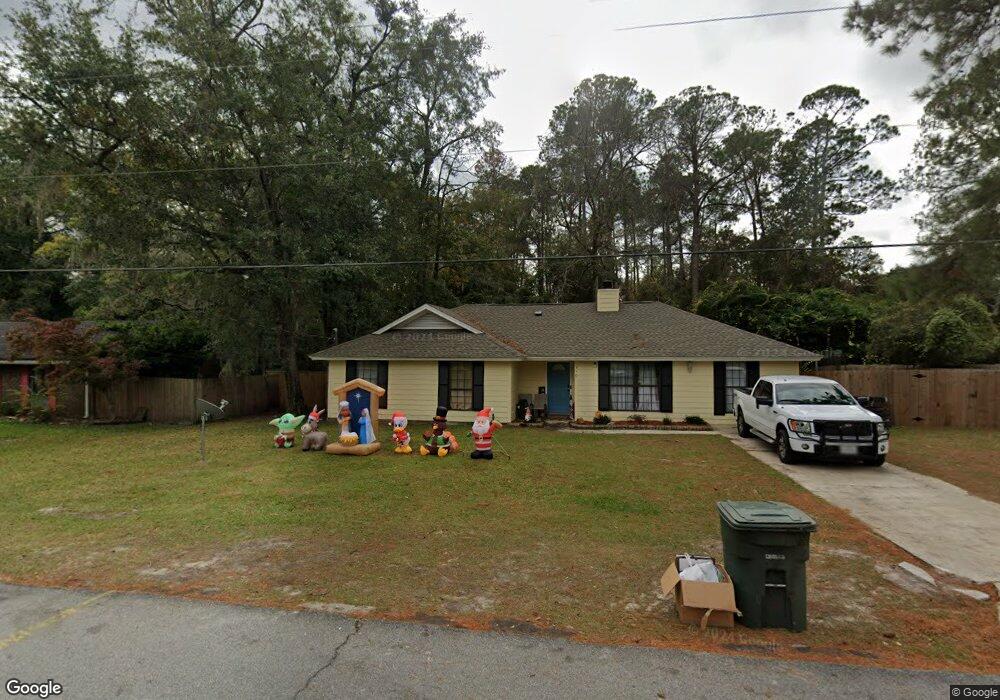
310 Floyd St Hinesville, GA 31313
Estimated Value: $242,267 - $267,000
3
Beds
2
Baths
1,399
Sq Ft
$181/Sq Ft
Est. Value
About This Home
This home is located at 310 Floyd St, Hinesville, GA 31313 and is currently estimated at $253,067, approximately $180 per square foot. 310 Floyd St is a home located in Liberty County with nearby schools including Joseph Martin Elementary School, Snelson-Golden Middle School, and Liberty County High School.
Ownership History
Date
Name
Owned For
Owner Type
Purchase Details
Closed on
Jan 17, 2023
Sold by
Union Park Llc
Bought by
Bruno Diego Rodriguez and Martinez Claudia
Current Estimated Value
Home Financials for this Owner
Home Financials are based on the most recent Mortgage that was taken out on this home.
Original Mortgage
$243,460
Outstanding Balance
$235,468
Interest Rate
6.27%
Mortgage Type
VA
Estimated Equity
$17,599
Purchase Details
Closed on
Dec 28, 2011
Sold by
Denis Rony
Bought by
Union Park Llc
Purchase Details
Closed on
Aug 19, 2005
Sold by
Cho Yong Y
Bought by
Denis Rony
Home Financials for this Owner
Home Financials are based on the most recent Mortgage that was taken out on this home.
Original Mortgage
$76,300
Interest Rate
5.64%
Mortgage Type
New Conventional
Purchase Details
Closed on
Apr 20, 2005
Sold by
Thomas John D
Bought by
Cho Yong Y
Purchase Details
Closed on
Mar 1, 1988
Bought by
Thomas John D
Create a Home Valuation Report for This Property
The Home Valuation Report is an in-depth analysis detailing your home's value as well as a comparison with similar homes in the area
Home Values in the Area
Average Home Value in this Area
Purchase History
| Date | Buyer | Sale Price | Title Company |
|---|---|---|---|
| Bruno Diego Rodriguez | $235,000 | -- | |
| Union Park Llc | -- | -- | |
| Denis Rony | $109,000 | -- | |
| Cho Yong Y | $54,000 | -- | |
| Thomas John D | $63,500 | -- |
Source: Public Records
Mortgage History
| Date | Status | Borrower | Loan Amount |
|---|---|---|---|
| Open | Bruno Diego Rodriguez | $243,460 | |
| Previous Owner | Denis Rony | $76,300 | |
| Previous Owner | Denis Rony | $27,250 |
Source: Public Records
Tax History Compared to Growth
Tax History
| Year | Tax Paid | Tax Assessment Tax Assessment Total Assessment is a certain percentage of the fair market value that is determined by local assessors to be the total taxable value of land and additions on the property. | Land | Improvement |
|---|---|---|---|---|
| 2024 | $3,936 | $80,158 | $16,000 | $64,158 |
| 2023 | $3,936 | $64,111 | $14,000 | $50,111 |
| 2022 | $2,520 | $54,068 | $14,000 | $40,068 |
| 2021 | $2,094 | $44,052 | $11,200 | $32,852 |
| 2020 | $2,065 | $43,027 | $11,200 | $31,827 |
| 2019 | $1,996 | $41,895 | $9,600 | $32,295 |
| 2018 | $2,007 | $42,363 | $9,600 | $32,763 |
| 2017 | $1,410 | $42,831 | $9,600 | $33,231 |
| 2016 | $1,883 | $41,694 | $9,600 | $32,094 |
| 2015 | $2,023 | $43,549 | $9,600 | $33,949 |
| 2014 | $2,023 | $44,349 | $10,400 | $33,949 |
| 2013 | -- | $44,349 | $10,400 | $33,949 |
Source: Public Records
Map
Nearby Homes
- 0 General Stewart Way
- 0 E General Stewart Way
- 411 Woodland Dr
- 24 Sherwood Dr
- 205 Wilson Ave
- 301 Lakeview Dr
- 108 W General Stewart Way
- 103 Stewart Terrace
- 830 Bradwell St
- 604 Caroline St
- 812 Spanish Oak Dr
- 822 Lakeview Ct
- 173 Ironwood Dr
- 1.76 AC Tranquill Way
- 1.76 AC Shyam Dr
- 804 Barrington Dr
- 4 Lots Memorial Dr
- 1 Oglethorpe Ave
- 996 Stone Ct
- 910 Kings Rd
- 310 Floyd St
- 402 Floyd St
- 402 Floyd Cir
- 406 Floyd St
- 309 Floyd St
- 306 Floyd St
- 306 Floyd St
- 462 Floyd Cir
- 305 Floyd St
- 704 Marlborough Ct
- 408 Floyd Cir
- 408 Floyd St
- 703 Marlborough Ct
- 304 Floyd St
- 0 Floyd St Unit 7023387
- 0 Floyd St Unit 3239262
- 0 Floyd St
- 456 Floyd Cir
- 610 Bradwell St
- 704 Hemingway Dr