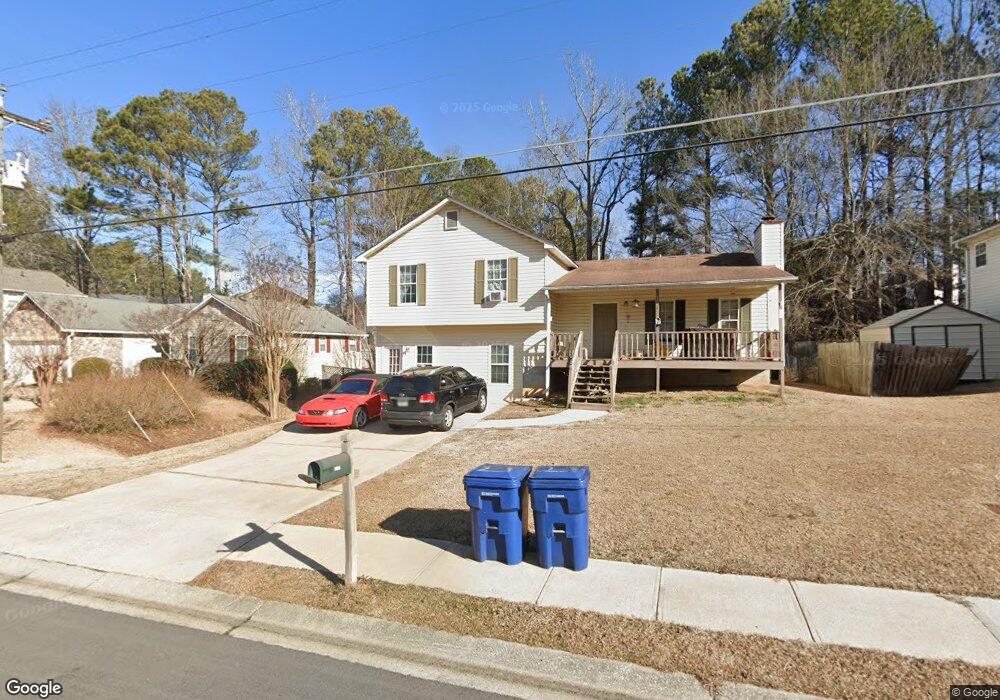
310 Ivy Brook Dr Dallas, GA 30157
Estimated Value: $269,000 - $307,000
3
Beds
2
Baths
1,200
Sq Ft
$237/Sq Ft
Est. Value
About This Home
This home is located at 310 Ivy Brook Dr, Dallas, GA 30157 and is currently estimated at $284,236, approximately $236 per square foot. 310 Ivy Brook Dr is a home located in Paulding County with nearby schools including Allgood Elementary School, Herschel Jones Middle School, and Paulding County High School.
Ownership History
Date
Name
Owned For
Owner Type
Purchase Details
Closed on
Feb 14, 2013
Sold by
Fowler Harry
Bought by
Tate Sam and Tate Ashley
Current Estimated Value
Purchase Details
Closed on
May 29, 2009
Sold by
Secretary Of Veterans Affairs
Bought by
Fowler Harry and Fowler Sandra
Purchase Details
Closed on
Mar 3, 2009
Sold by
Midfirst Bk
Bought by
Secretary Of Veterans Affairs
Purchase Details
Closed on
May 27, 2008
Sold by
Brissette Corey and Brissette Jennifer
Bought by
Brissette Family Trust
Purchase Details
Closed on
Jan 30, 2008
Sold by
Brissette Family Trust
Bought by
Drive Ivy B Family Trust
Purchase Details
Closed on
Apr 14, 2003
Sold by
Bickers A L
Bought by
Brissette Corey
Home Financials for this Owner
Home Financials are based on the most recent Mortgage that was taken out on this home.
Original Mortgage
$110,364
Interest Rate
5.6%
Mortgage Type
VA
Create a Home Valuation Report for This Property
The Home Valuation Report is an in-depth analysis detailing your home's value as well as a comparison with similar homes in the area
Home Values in the Area
Average Home Value in this Area
Purchase History
| Date | Buyer | Sale Price | Title Company |
|---|---|---|---|
| Tate Sam | -- | -- | |
| Fowler Harry | $48,000 | -- | |
| Secretary Of Veterans Affairs | -- | -- | |
| Midfirst Bk | $66,097 | -- | |
| Brissette Family Trust | -- | -- | |
| Drive Ivy B Family Trust | $6,500 | -- | |
| Brissette Corey | $108,200 | -- |
Source: Public Records
Mortgage History
| Date | Status | Borrower | Loan Amount |
|---|---|---|---|
| Previous Owner | Brissette Corey | $110,364 |
Source: Public Records
Tax History Compared to Growth
Tax History
| Year | Tax Paid | Tax Assessment Tax Assessment Total Assessment is a certain percentage of the fair market value that is determined by local assessors to be the total taxable value of land and additions on the property. | Land | Improvement |
|---|---|---|---|---|
| 2024 | $3,217 | $103,108 | $12,000 | $91,108 |
| 2023 | $3,115 | $103,008 | $12,000 | $91,008 |
| 2022 | $2,401 | $92,084 | $12,000 | $80,084 |
| 2021 | $1,960 | $67,452 | $8,000 | $59,452 |
| 2020 | $2,020 | $59,652 | $8,000 | $51,652 |
| 2019 | $1,876 | $54,696 | $8,000 | $46,696 |
| 2018 | $1,381 | $45,848 | $8,000 | $37,848 |
| 2017 | $1,472 | $42,396 | $8,000 | $34,396 |
| 2016 | $1,188 | $34,528 | $8,000 | $26,528 |
| 2015 | $977 | $31,740 | $8,000 | $23,740 |
| 2014 | $920 | $29,132 | $8,000 | $21,132 |
| 2013 | -- | $16,800 | $8,000 | $8,800 |
Source: Public Records
Map
Nearby Homes
- 302 Ivy Brook Dr
- 201 Ivy Brook Dr
- 409 Ivy Terrace Dr
- 306 Station Dr
- 218 Depot Ln
- 68 Oakdale Path
- 127 Laurel Farms Ln
- 590 Villa Rica Hwy
- Amelia Plan at Laurel Farms - Designer Collection
- Morgan Plan at Laurel Farms - Designer Collection
- Maxwell Plan at Laurel Farms - Designer Collection
- Edenton Plan at Laurel Farms - Designer Collection
- Wilmington Plan at Laurel Farms - Designer Collection
- Camden Plan at Laurel Farms - Designer Collection
- 148 Laurel Farms Ln
- 125 Laurel Farms Ln
- 138 Laurel Farms Ln
- 115 Laurel Farms Ln
- 112 Laurel Farms Ln
- 128 Laurel Farms Ln
- 312 Ivy Brook Dr
- 308 Ivy Brook Dr
- 0 Ivy Brook Dr Unit 7462787
- 0 Ivy Brook Dr Unit 7417388
- 0 Ivy Brook Dr Unit 7335764
- 0 Ivy Brook Dr Unit 8871608
- 0 Ivy Brook Dr Unit 8857288
- 0 Ivy Brook Dr Unit 8743736
- 0 Ivy Brook Dr Unit 8011538
- 0 Ivy Brook Dr Unit 8706704
- 0 Ivy Brook Dr Unit 3149646
- 0 Ivy Brook Dr Unit 7356921
- 0 Ivy Brook Dr Unit 3137832
- 0 Ivy Brook Dr
- 111 Ivy Mill Way
- 314 Ivy Brook Dr
- 306 Ivy Brook Dr
- 113 Ivy Mill Way
- 109 Ivy Mill Way
- 110 Ivy Green Ct