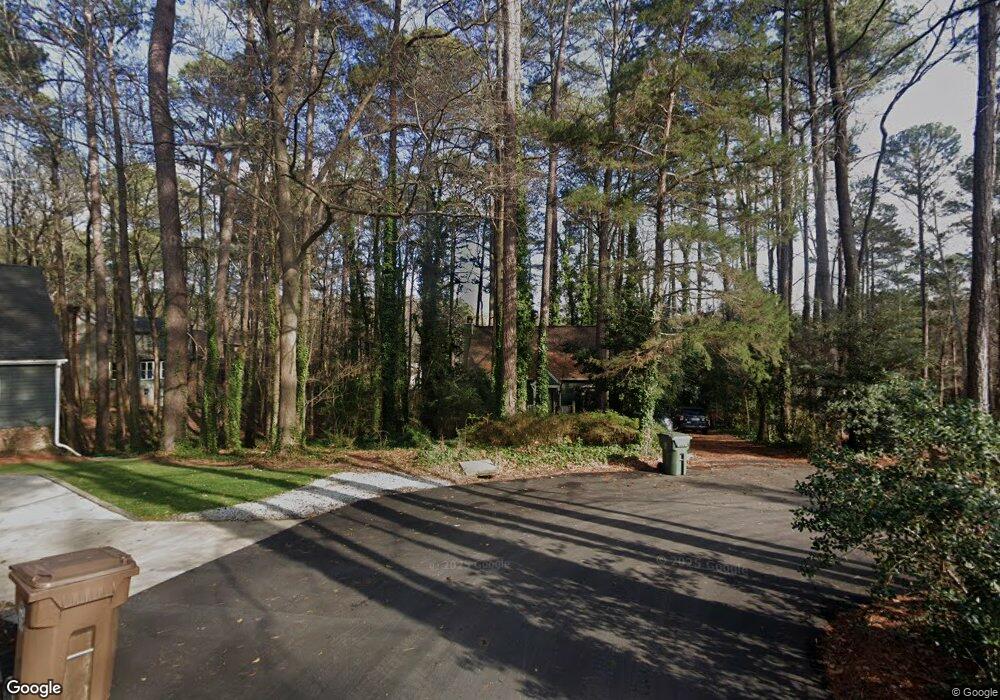
310 King Charles Ln Cary, NC 27511
South Cary NeighborhoodEstimated Value: $517,000 - $556,000
4
Beds
3
Baths
2,836
Sq Ft
$190/Sq Ft
Est. Value
About This Home
This home is located at 310 King Charles Ln, Cary, NC 27511 and is currently estimated at $537,986, approximately $189 per square foot. 310 King Charles Ln is a home located in Wake County with nearby schools including Briarcliff Elementary School, East Cary Middle School, and Cary High School.
Ownership History
Date
Name
Owned For
Owner Type
Purchase Details
Closed on
Jun 9, 2006
Sold by
Stewart Ian D and Valdez Amorita E
Bought by
Neill Mark and Neill Michelle
Current Estimated Value
Home Financials for this Owner
Home Financials are based on the most recent Mortgage that was taken out on this home.
Original Mortgage
$173,520
Outstanding Balance
$101,615
Interest Rate
6.5%
Mortgage Type
New Conventional
Estimated Equity
$436,371
Purchase Details
Closed on
Nov 5, 2004
Sold by
Osborn R A and Osborn Jennifer Leigh
Bought by
Stewart Ian D and Valdez Amorita E
Home Financials for this Owner
Home Financials are based on the most recent Mortgage that was taken out on this home.
Original Mortgage
$159,900
Interest Rate
5.5%
Mortgage Type
Purchase Money Mortgage
Purchase Details
Closed on
May 23, 2002
Sold by
Osborn R A
Bought by
Osborn R A and Osborn Jennifer Leigh
Create a Home Valuation Report for This Property
The Home Valuation Report is an in-depth analysis detailing your home's value as well as a comparison with similar homes in the area
Home Values in the Area
Average Home Value in this Area
Purchase History
| Date | Buyer | Sale Price | Title Company |
|---|---|---|---|
| Neill Mark | $217,000 | None Available | |
| Stewart Ian D | $200,000 | -- | |
| Osborn R A | -- | -- |
Source: Public Records
Mortgage History
| Date | Status | Borrower | Loan Amount |
|---|---|---|---|
| Open | Neill Mark | $173,520 | |
| Previous Owner | Stewart Ian D | $159,900 | |
| Closed | Stewart Ian D | $20,900 |
Source: Public Records
Tax History Compared to Growth
Tax History
| Year | Tax Paid | Tax Assessment Tax Assessment Total Assessment is a certain percentage of the fair market value that is determined by local assessors to be the total taxable value of land and additions on the property. | Land | Improvement |
|---|---|---|---|---|
| 2025 | $3,553 | $412,254 | $175,000 | $237,254 |
| 2024 | $3,477 | $412,254 | $175,000 | $237,254 |
| 2023 | $2,945 | $291,897 | $110,000 | $181,897 |
| 2022 | $2,835 | $291,897 | $110,000 | $181,897 |
| 2021 | $2,778 | $291,897 | $110,000 | $181,897 |
| 2020 | $2,793 | $291,897 | $110,000 | $181,897 |
| 2019 | $2,437 | $225,723 | $76,000 | $149,723 |
| 2018 | $2,287 | $225,723 | $76,000 | $149,723 |
| 2017 | $2,198 | $225,723 | $76,000 | $149,723 |
| 2016 | $2,166 | $225,723 | $76,000 | $149,723 |
| 2015 | $2,097 | $210,948 | $60,000 | $150,948 |
| 2014 | $1,978 | $210,948 | $60,000 | $150,948 |
Source: Public Records
Map
Nearby Homes
- 148 Carmichael Ct Unit 9C
- 205 Carmichael Ct Unit 13A
- 101 Flora McDonald Ln
- 103 Bonnell Ct
- 103 Lakeway Ct
- 107 Bonnell Ct
- 216 Climbing Ivy Ct
- 135 Drummond Place Unit 7C
- 210 Crimmons Cir
- 102 Climbing Ivy Ct
- 114 Drummond Place
- 122 Clancy Cir
- 205 Kingsmill Rd
- 113 Spring Cove Dr
- 204 Okelly Ln
- 104 Pickett Ln
- 210 Twin Oaks Place
- 130 Castlewood Dr
- 300 Mainsail Dr
- 124 Twin Oaks Place
- 308 King Charles Ln
- 312 King Charles Ln
- 122 Flora McDonald Ln
- 306 King Charles Ln
- 123 Flora McDonald Ln
- 518 Lochness Ln
- 304 King Charles Ln
- 520 Lochness Ln
- 314 King Charles Ln
- 417 Glen Bonnie Ln
- 415 Glen Bonnie Ln
- 316 King Charles Ln
- 121 Flora McDonald Ln
- 302 King Charles Ln
- 516 Lochness Ln
- 414 Glen Bonnie Ln
- 104 Two Creeks Rd
- 114 Flora McDonald Ln
- 413 Glen Bonnie Ln
- 188 Flora McDonald Ln