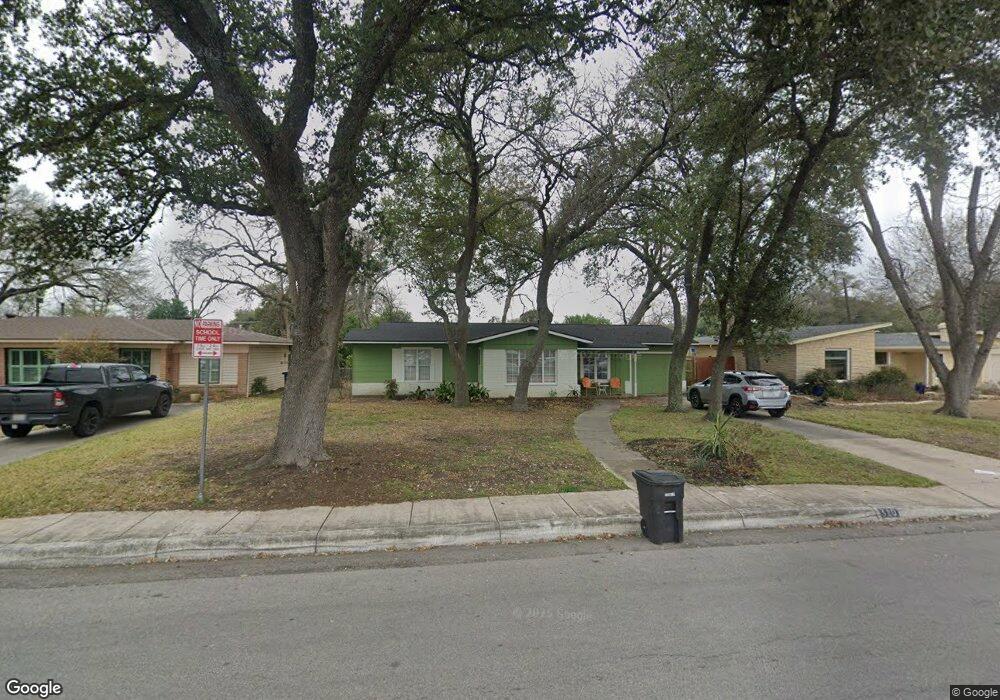
310 Larkwood Dr San Antonio, TX 78209
Oak Park-Northwood NeighborhoodEstimated Value: $456,292 - $532,000
3
Beds
2
Baths
1,478
Sq Ft
$327/Sq Ft
Est. Value
About This Home
This home is located at 310 Larkwood Dr, San Antonio, TX 78209 and is currently estimated at $483,323, approximately $327 per square foot. 310 Larkwood Dr is a home located in Bexar County with nearby schools including Woodridge Elementary School, Alamo Heights Junior School, and Alamo Heights High School.
Ownership History
Date
Name
Owned For
Owner Type
Purchase Details
Closed on
Jul 14, 2020
Sold by
Bennett Steve W
Bought by
Bennett Steven W and Steven W Bennett Living Trust
Current Estimated Value
Purchase Details
Closed on
Jul 27, 2005
Sold by
Martin William Wyatt and The William Wyatt Martin Jr Re
Bought by
Bennett Steve W
Home Financials for this Owner
Home Financials are based on the most recent Mortgage that was taken out on this home.
Original Mortgage
$124,000
Outstanding Balance
$64,678
Interest Rate
5.55%
Mortgage Type
Fannie Mae Freddie Mac
Estimated Equity
$418,645
Purchase Details
Closed on
Mar 2, 1999
Sold by
Martin William Wyatt
Bought by
Revoca Martin Jr William Wyatt and Revoca William Wyatt Martin Jr
Purchase Details
Closed on
May 25, 1995
Sold by
Bronson Howard F
Bought by
Martin William Wyatt
Home Financials for this Owner
Home Financials are based on the most recent Mortgage that was taken out on this home.
Original Mortgage
$98,550
Interest Rate
8.18%
Create a Home Valuation Report for This Property
The Home Valuation Report is an in-depth analysis detailing your home's value as well as a comparison with similar homes in the area
Home Values in the Area
Average Home Value in this Area
Purchase History
| Date | Buyer | Sale Price | Title Company |
|---|---|---|---|
| Bennett Steven W | -- | None Available | |
| Bennett Steve W | -- | Commerce Title | |
| Revoca Martin Jr William Wyatt | -- | -- | |
| Revoca Martin Jr William Wyatt | -- | -- | |
| Martin William Wyatt | -- | -- |
Source: Public Records
Mortgage History
| Date | Status | Borrower | Loan Amount |
|---|---|---|---|
| Open | Bennett Steve W | $124,000 | |
| Previous Owner | Martin William Wyatt | $98,550 |
Source: Public Records
Tax History Compared to Growth
Tax History
| Year | Tax Paid | Tax Assessment Tax Assessment Total Assessment is a certain percentage of the fair market value that is determined by local assessors to be the total taxable value of land and additions on the property. | Land | Improvement |
|---|---|---|---|---|
| 2025 | $8,195 | $487,460 | $279,890 | $207,570 |
| 2024 | $8,195 | $457,004 | $279,890 | $218,790 |
| 2023 | $8,195 | $415,458 | $279,890 | $196,350 |
| 2022 | $9,143 | $377,689 | $193,280 | $220,300 |
| 2021 | $8,569 | $343,354 | $168,080 | $180,640 |
| 2020 | $7,798 | $312,140 | $116,030 | $196,110 |
| 2019 | $7,986 | $312,140 | $116,030 | $196,110 |
| 2018 | $7,612 | $303,870 | $116,030 | $187,840 |
| 2017 | $7,117 | $284,150 | $116,030 | $168,120 |
| 2016 | $6,543 | $261,200 | $103,700 | $157,500 |
| 2015 | $5,805 | $258,110 | $103,700 | $154,410 |
| 2014 | $5,805 | $236,850 | $0 | $0 |
Source: Public Records
Map
Nearby Homes
- 318 Northridge Dr
- 315 Tophill Rd
- 215 Tophill Rd
- 623 E Nottingham Dr
- 205 Larkwood Dr
- 351 Northridge Dr
- 127 Larkwood Dr
- 631 Robinhood Place
- 215 Oakleaf Dr
- 419 Woodcrest Dr
- 411 E Nottingham Dr
- 247 Ridgehaven Place
- 303 Ridgehaven Place
- 510 Woodcrest Dr
- 134 Rockhill Dr
- 611 Brightwood Place
- 539 Brightwood Place
- 602 Brightwood Place
- 534 Brightwood Place
- 2611 Eisenhauer Rd Unit 1502
- 314 Larkwood Dr
- 306 Larkwood Dr
- 251 Northridge Dr
- 318 Larkwood Dr
- 302 Larkwood Dr
- 247 Northridge Dr
- 303 Northridge Dr
- 243 Northridge Dr
- 322 Larkwood Dr
- 234 Larkwood Dr
- 307 Northridge Dr
- 235 Northridge Dr
- 326 Larkwood Dr
- 230 Larkwood Dr
- 242 Northridge Dr
- 311 Northridge Dr
- 302 Northridge Dr
- 231 Larkwood Dr
- 231 Northridge Dr
- 238 Northridge Dr