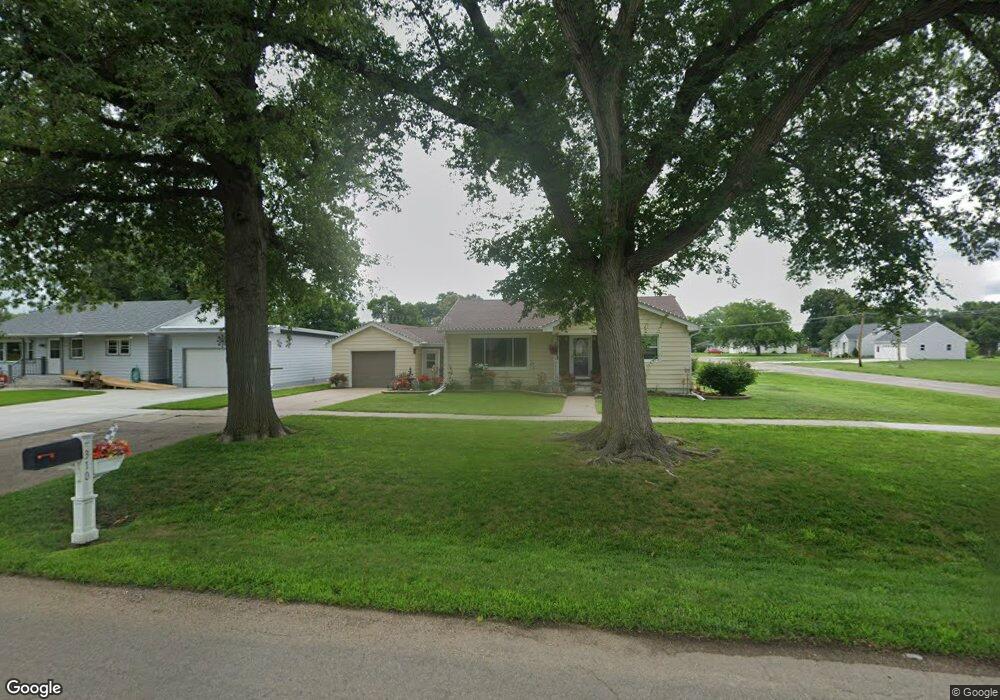
310 N 11th St David City, NE 68632
Estimated Value: $173,000 - $236,000
2
Beds
1
Bath
1,095
Sq Ft
$192/Sq Ft
Est. Value
About This Home
This home is located at 310 N 11th St, David City, NE 68632 and is currently estimated at $210,075, approximately $191 per square foot. 310 N 11th St is a home located in Butler County with nearby schools including David City Secondary School, St. Mary's School, and Aquinas High School.
Ownership History
Date
Name
Owned For
Owner Type
Purchase Details
Closed on
Sep 6, 2011
Sold by
First National Bank
Bought by
Marushak Michael L
Current Estimated Value
Home Financials for this Owner
Home Financials are based on the most recent Mortgage that was taken out on this home.
Original Mortgage
$85,800
Interest Rate
4.58%
Purchase Details
Closed on
Nov 25, 2008
Sold by
First National Bank And Trust
Bought by
Marushak Michael L
Home Financials for this Owner
Home Financials are based on the most recent Mortgage that was taken out on this home.
Original Mortgage
$87,450
Interest Rate
5.99%
Purchase Details
Closed on
Nov 22, 2008
Sold by
Wondercheck Wayne D and Wondercheck Warren
Bought by
Marushak Michael L
Home Financials for this Owner
Home Financials are based on the most recent Mortgage that was taken out on this home.
Original Mortgage
$87,450
Interest Rate
5.99%
Create a Home Valuation Report for This Property
The Home Valuation Report is an in-depth analysis detailing your home's value as well as a comparison with similar homes in the area
Home Values in the Area
Average Home Value in this Area
Purchase History
| Date | Buyer | Sale Price | Title Company |
|---|---|---|---|
| Marushak Michael L | $85,850 | -- | |
| Marushak Michael L | $87,450 | -- | |
| Marushak Michael L | -- | -- |
Source: Public Records
Mortgage History
| Date | Status | Borrower | Loan Amount |
|---|---|---|---|
| Closed | Marushak Michael L | $85,800 | |
| Previous Owner | Marushak Michael L | $87,450 |
Source: Public Records
Tax History Compared to Growth
Tax History
| Year | Tax Paid | Tax Assessment Tax Assessment Total Assessment is a certain percentage of the fair market value that is determined by local assessors to be the total taxable value of land and additions on the property. | Land | Improvement |
|---|---|---|---|---|
| 2024 | $1,884 | $156,560 | $17,850 | $138,710 |
| 2023 | $2,130 | $142,535 | $17,850 | $124,685 |
| 2022 | $1,930 | $125,485 | $17,850 | $107,635 |
| 2021 | $1,791 | $116,295 | $10,500 | $105,795 |
| 2020 | $1,771 | $112,980 | $10,500 | $102,480 |
| 2019 | $1,636 | $104,740 | $10,500 | $94,240 |
| 2018 | $1,586 | $103,140 | $10,500 | $92,640 |
| 2017 | $1,555 | $101,265 | $10,500 | $90,765 |
| 2016 | $1,461 | $96,970 | $10,500 | $86,470 |
| 2015 | $1,525 | $94,735 | $10,500 | $84,235 |
| 2014 | $1,492 | $89,495 | $10,500 | $78,995 |
Source: Public Records
Map
Nearby Homes