Estimated Value: $73,486 - $79,000
1
Bed
1
Bath
822
Sq Ft
$93/Sq Ft
Est. Value
About This Home
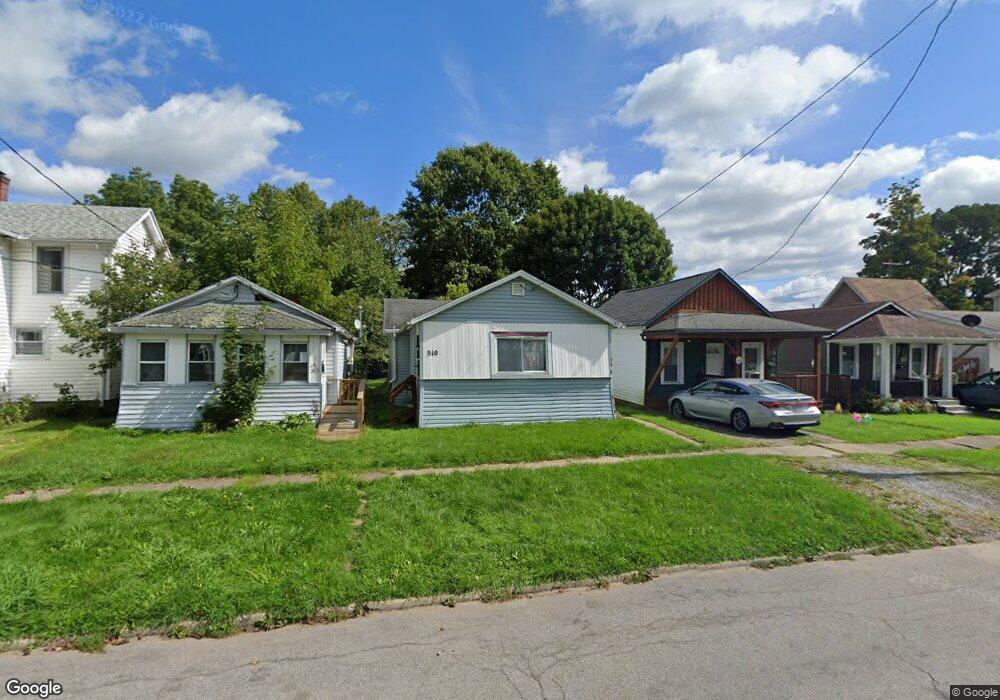
This home is located at 310 N 13th St, Olean, NY 14760 and is currently estimated at $76,122, approximately $92 per square foot. 310 N 13th St is a home located in Cattaraugus County with nearby schools including Olean Intermediate-Middle School, Olean Senior High School, and Southern Tier Catholic School.
Ownership History
Date
Name
Owned For
Owner Type
Purchase Details
Closed on
May 20, 2019
Sold by
County Of Cattaraugus
Bought by
Attwell David
Current Estimated Value
Purchase Details
Closed on
May 8, 2019
Sold by
County Of Cattaraugus
Bought by
Attwell David
Purchase Details
Closed on
Mar 26, 2019
Sold by
County Treasurer
Bought by
County Of Cattaraugus
Purchase Details
Closed on
Feb 26, 2019
Sold by
County Treasurer
Bought by
County Of Cattaraugus
Purchase Details
Closed on
Nov 14, 2013
Sold by
Resea St. Jude Children'S
Bought by
Attwell David R
Purchase Details
Closed on
Jan 14, 2003
Sold by
Ford Anderson
Bought by
Ozogar Andrew
Purchase Details
Closed on
Sep 16, 2002
Sold by
Jaques Thomas R
Bought by
Ford Anderson
Purchase Details
Closed on
Apr 28, 1995
Sold by
Neff Bradley C and Neff Marilyn J
Bought by
Jaques Thomas R
Create a Home Valuation Report for This Property
The Home Valuation Report is an in-depth analysis detailing your home's value as well as a comparison with similar homes in the area
Home Values in the Area
Average Home Value in this Area
Purchase History
| Date | Buyer | Sale Price | Title Company |
|---|---|---|---|
| Attwell David | $4,992 | None Available | |
| Attwell David | $4,992 | None Available | |
| Atwell David R | $4,992 | -- | |
| County Of Cattaraugus | -- | None Available | |
| County Of Cattaraugus | -- | None Available | |
| Cattaraugus County Of | -- | -- | |
| Attwell David R | $5,000 | Daniel Palumbo | |
| Ozogar Andrew | -- | -- | |
| Ford Anderson | $21,500 | Carl Robert Vahl | |
| Jaques Thomas R | $16,000 | -- |
Source: Public Records
Tax History
| Year | Tax Paid | Tax Assessment Tax Assessment Total Assessment is a certain percentage of the fair market value that is determined by local assessors to be the total taxable value of land and additions on the property. | Land | Improvement |
|---|---|---|---|---|
| 2025 | $1,574 | $24,900 | $3,100 | $21,800 |
| 2024 | $1,574 | $24,900 | $3,100 | $21,800 |
| 2023 | $937 | $24,900 | $3,100 | $21,800 |
| 2022 | $951 | $24,900 | $3,100 | $21,800 |
| 2021 | $978 | $24,900 | $3,100 | $21,800 |
| 2020 | $2,120 | $24,900 | $3,100 | $21,800 |
| 2019 | $374 | $24,900 | $3,100 | $21,800 |
| 2018 | $2,461 | $24,900 | $3,100 | $21,800 |
| 2017 | $2,132 | $24,900 | $3,100 | $21,800 |
| 2016 | $2,111 | $24,900 | $3,100 | $21,800 |
| 2015 | -- | $24,900 | $3,100 | $21,800 |
| 2014 | -- | $24,900 | $3,100 | $21,800 |
Source: Public Records
Map
Nearby Homes
Your Personal Tour Guide
Ask me questions while you tour the home.