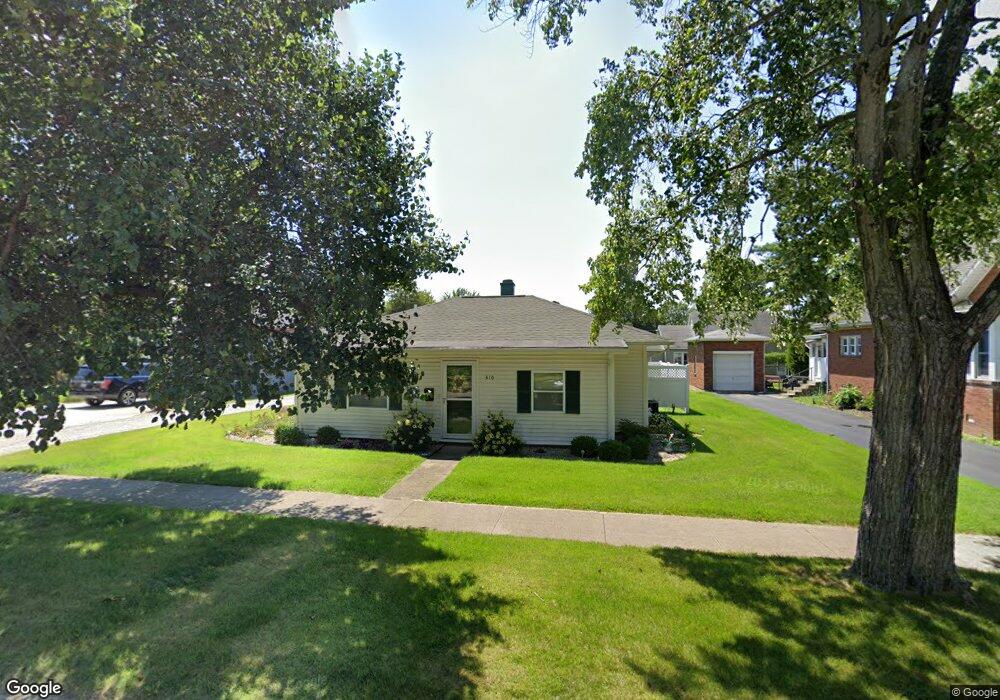
310 N 6th St Marshall, IL 62441
Estimated Value: $97,000 - $123,000
2
Beds
--
Bath
1,071
Sq Ft
$106/Sq Ft
Est. Value
About This Home
This home is located at 310 N 6th St, Marshall, IL 62441 and is currently estimated at $113,000, approximately $105 per square foot. 310 N 6th St is a home located in Clark County with nearby schools including South Elementary School, North Elementary School, and Marshall Junior High School.
Ownership History
Date
Name
Owned For
Owner Type
Purchase Details
Closed on
May 15, 2023
Sold by
Low Penny L
Bought by
Wellum Robert B M and Wellum Amber C
Current Estimated Value
Home Financials for this Owner
Home Financials are based on the most recent Mortgage that was taken out on this home.
Original Mortgage
$76,000
Outstanding Balance
$72,042
Interest Rate
8%
Mortgage Type
New Conventional
Estimated Equity
$40,958
Purchase Details
Closed on
Oct 31, 2017
Sold by
Rardin David M and Rardin Dianne
Bought by
Low Penny L
Home Financials for this Owner
Home Financials are based on the most recent Mortgage that was taken out on this home.
Original Mortgage
$60,000
Interest Rate
4.5%
Mortgage Type
Adjustable Rate Mortgage/ARM
Purchase Details
Closed on
Apr 10, 2008
Sold by
Gard Robert E and Gard Carol A
Bought by
Rardin David M and Rardin Dianne
Home Financials for this Owner
Home Financials are based on the most recent Mortgage that was taken out on this home.
Original Mortgage
$60,000
Interest Rate
6.32%
Mortgage Type
New Conventional
Create a Home Valuation Report for This Property
The Home Valuation Report is an in-depth analysis detailing your home's value as well as a comparison with similar homes in the area
Home Values in the Area
Average Home Value in this Area
Purchase History
| Date | Buyer | Sale Price | Title Company |
|---|---|---|---|
| Wellum Robert B M | $83,000 | None Listed On Document | |
| Low Penny L | $75,000 | Attorney | |
| Rardin David M | $75,000 | None Available |
Source: Public Records
Mortgage History
| Date | Status | Borrower | Loan Amount |
|---|---|---|---|
| Open | Wellum Robert B M | $76,000 | |
| Previous Owner | Low Penny L | $60,000 | |
| Previous Owner | Rardin David M | $60,000 |
Source: Public Records
Tax History
| Year | Tax Paid | Tax Assessment Tax Assessment Total Assessment is a certain percentage of the fair market value that is determined by local assessors to be the total taxable value of land and additions on the property. | Land | Improvement |
|---|---|---|---|---|
| 2024 | $1,861 | $28,743 | $4,967 | $23,776 |
| 2023 | $1,465 | $28,743 | $4,967 | $23,776 |
| 2022 | $848 | $25,664 | $4,435 | $21,229 |
| 2021 | $917 | $23,985 | $4,145 | $19,840 |
| 2019 | $938 | $23,985 | $4,145 | $19,840 |
| 2018 | $1,010 | $23,985 | $4,145 | $19,840 |
| 2017 | $1,846 | $24,529 | $4,239 | $20,290 |
| 2016 | $1,905 | $23,985 | $4,145 | $19,840 |
| 2015 | $1,922 | $24,704 | $3,945 | $20,759 |
| 2014 | $1,841 | $24,045 | $3,840 | $20,205 |
| 2013 | $1,841 | $23,230 | $3,710 | $19,520 |
Source: Public Records
Map
Nearby Homes
- 815 N 6th St
- 1014 Plum St
- 1202 N 10th St
- 110 Linden St
- 107 Linden St
- 812 S 4th St
- 209 Elm St
- 15827 N Oak Crest Rd
- 0 Myrtle St
- 17383 N Hummingbird Ln
- 103 Kyden Dr
- 10 Rose Ln
- 7 Willow Ln
- 10 Lakeview Dr
- 4 Woodridge Ln
- 17739 N Mechanic St
- 12040 N Fox Rd
- South 500th Grand Turn Rd
- 104 Woodland Dr
- 19996 N 2250th St
Your Personal Tour Guide
Ask me questions while you tour the home.