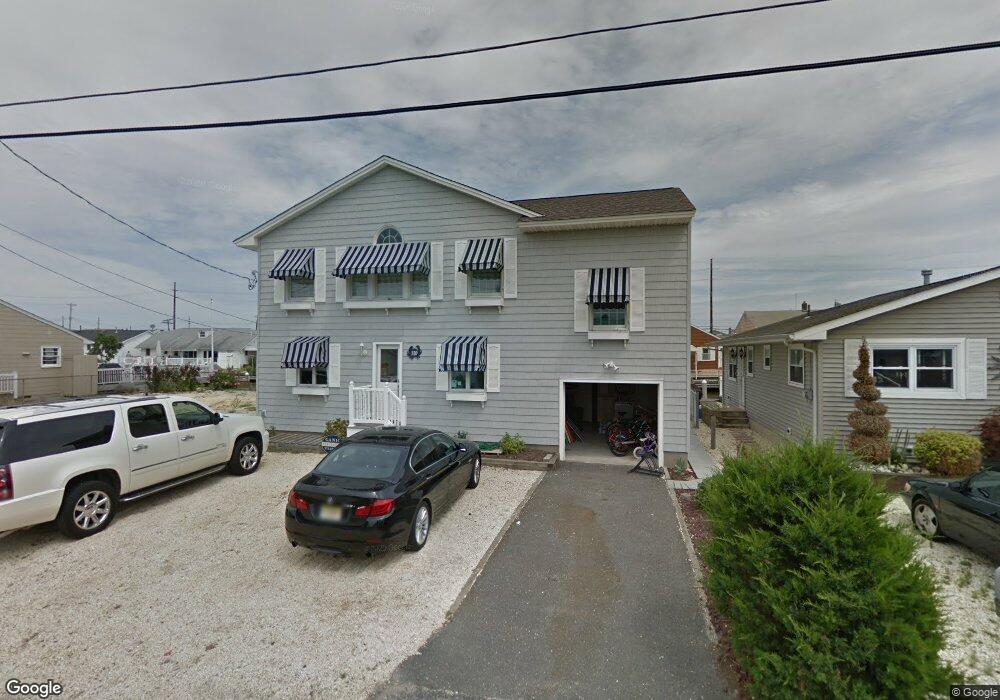
310 N Bay Dr Mantoloking, NJ 08738
Estimated Value: $1,556,000 - $2,145,000
5
Beds
3
Baths
2,548
Sq Ft
$749/Sq Ft
Est. Value
About This Home
This home is located at 310 N Bay Dr, Mantoloking, NJ 08738 and is currently estimated at $1,907,367, approximately $748 per square foot. 310 N Bay Dr is a home located in Ocean County with nearby schools including Emma Havens Young Elementary School, Lake Riviera Middle School, and Brick Township High School.
Ownership History
Date
Name
Owned For
Owner Type
Purchase Details
Closed on
Jan 21, 2021
Sold by
Scancarella Joan and Scancarella Joseph F
Bought by
Scancarella Joseph F and Scancarella Joan
Current Estimated Value
Purchase Details
Closed on
Jan 19, 2006
Sold by
Posess Carol and Posess Louis
Bought by
Scancarella Joan
Home Financials for this Owner
Home Financials are based on the most recent Mortgage that was taken out on this home.
Original Mortgage
$198,000
Interest Rate
5.87%
Mortgage Type
Purchase Money Mortgage
Purchase Details
Closed on
Jan 26, 2004
Sold by
Posess Louis
Bought by
Posess Carol
Purchase Details
Closed on
Jul 29, 2003
Sold by
Chach Mary
Bought by
Posess Louis and Posess Carol
Create a Home Valuation Report for This Property
The Home Valuation Report is an in-depth analysis detailing your home's value as well as a comparison with similar homes in the area
Home Values in the Area
Average Home Value in this Area
Purchase History
| Date | Buyer | Sale Price | Title Company |
|---|---|---|---|
| Scancarella Joseph F | -- | None Available | |
| Scancarella Joseph F | -- | None Listed On Document | |
| Scancarella Joan | $1,129,000 | None Available | |
| Posess Carol | -- | -- | |
| Posess Louis | $725,000 | -- |
Source: Public Records
Mortgage History
| Date | Status | Borrower | Loan Amount |
|---|---|---|---|
| Previous Owner | Scancarella Joan | $198,000 |
Source: Public Records
Tax History Compared to Growth
Tax History
| Year | Tax Paid | Tax Assessment Tax Assessment Total Assessment is a certain percentage of the fair market value that is determined by local assessors to be the total taxable value of land and additions on the property. | Land | Improvement |
|---|---|---|---|---|
| 2025 | $17,014 | $658,700 | $441,300 | $217,400 |
| 2024 | $16,171 | $658,700 | $441,300 | $217,400 |
| 2023 | $15,960 | $658,700 | $441,300 | $217,400 |
| 2022 | $15,960 | $658,700 | $441,300 | $217,400 |
| 2021 | $15,624 | $658,700 | $441,300 | $217,400 |
| 2020 | $15,427 | $658,700 | $441,300 | $217,400 |
| 2019 | $15,170 | $658,700 | $441,300 | $217,400 |
| 2018 | $14,821 | $658,700 | $441,300 | $217,400 |
| 2017 | $14,452 | $660,200 | $441,300 | $218,900 |
| 2016 | $14,379 | $660,200 | $441,300 | $218,900 |
| 2015 | $14,003 | $660,200 | $441,300 | $218,900 |
| 2014 | $13,891 | $594,500 | $441,300 | $153,200 |
Source: Public Records
Map
Nearby Homes
- 308 Cove Dr
- 366 Highway 35 N
- 304 Schooner Ln
- 438 Highway 35 N Unit 1304
- 12 Shell Rd
- 150 Sunset Ln
- 275 Curtis Point Dr
- 233 Curtis Point Dr
- 122 Squan Beach Dr
- 515 New Jersey 35
- 545 Route 35
- 254 Harbor Ct
- 1519 Runyon Ln
- 417 Delray Dr
- 124 Saint Lawrence Blvd
- 26 N Surf Rd
- 108 Rochester Dr
- 465 Boca Raton Dr
- 34 S Surf Rd
- 77 Rochester Dr