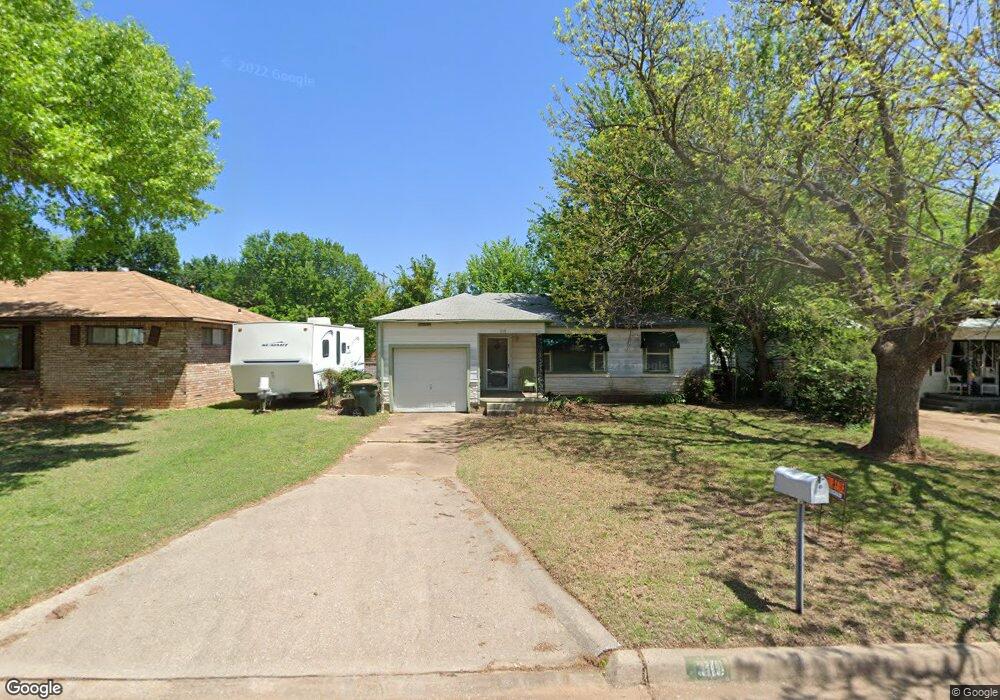
310 N E St Duncan, OK 73533
Estimated Value: $55,000 - $63,000
3
Beds
1
Bath
1,376
Sq Ft
$42/Sq Ft
Est. Value
About This Home
This home is located at 310 N E St, Duncan, OK 73533 and is currently estimated at $57,886, approximately $42 per square foot. 310 N E St is a home located in Stephens County with nearby schools including Woodrow Wilson Elementary School, Duncan Middle School, and Duncan High School.
Ownership History
Date
Name
Owned For
Owner Type
Purchase Details
Closed on
Apr 26, 2024
Sold by
Coberly Gary and Coberly Helen
Bought by
Leanos Miguel and Leanos Valory
Current Estimated Value
Purchase Details
Closed on
Apr 6, 2024
Sold by
Mackey Jordan
Bought by
Coberly Gary and Coberly Helen
Purchase Details
Closed on
Dec 8, 2023
Sold by
Mackey Jordan
Bought by
Mackey Jordan and Coberly Gary
Home Financials for this Owner
Home Financials are based on the most recent Mortgage that was taken out on this home.
Original Mortgage
$18,641
Interest Rate
7.29%
Mortgage Type
New Conventional
Purchase Details
Closed on
Oct 23, 2007
Sold by
Luckett Peggy O
Bought by
Gooden Billy R and Gooden Susan K
Purchase Details
Closed on
Oct 20, 2000
Sold by
Gibson Alice D
Purchase Details
Closed on
Aug 2, 1991
Create a Home Valuation Report for This Property
The Home Valuation Report is an in-depth analysis detailing your home's value as well as a comparison with similar homes in the area
Purchase History
| Date | Buyer | Sale Price | Title Company |
|---|---|---|---|
| Leanos Miguel | $22,000 | None Listed On Document | |
| Coberly Gary | -- | None Listed On Document | |
| Coberly Gary | -- | None Listed On Document | |
| Mackey Jordan | -- | None Listed On Document | |
| Mackey Jordan | -- | None Listed On Document | |
| Gooden Billy R | -- | None Available | |
| -- | -- | -- | |
| -- | $26,500 | -- |
Source: Public Records
Mortgage History
| Date | Status | Borrower | Loan Amount |
|---|---|---|---|
| Previous Owner | Mackey Jordan | $18,641 |
Source: Public Records
Tax History
| Year | Tax Paid | Tax Assessment Tax Assessment Total Assessment is a certain percentage of the fair market value that is determined by local assessors to be the total taxable value of land and additions on the property. | Land | Improvement |
|---|---|---|---|---|
| 2025 | $236 | $2,798 | $304 | $2,494 |
| 2024 | $170 | $2,001 | $304 | $1,697 |
| 2023 | $170 | $1,998 | $304 | $1,694 |
| 2022 | $233 | $3,164 | $304 | $2,860 |
| 2021 | $233 | $2,739 | $304 | $2,435 |
| 2020 | $214 | $2,484 | $304 | $2,180 |
| 2019 | $205 | $2,366 | $304 | $2,062 |
| 2018 | $269 | $3,019 | $304 | $2,715 |
| 2017 | $270 | $3,137 | $304 | $2,833 |
| 2016 | $338 | $3,974 | $304 | $3,670 |
| 2015 | $286 | $3,785 | $304 | $3,481 |
| 2014 | $286 | $3,605 | $335 | $3,270 |
Source: Public Records
Map
Nearby Homes
Your Personal Tour Guide
Ask me questions while you tour the home.