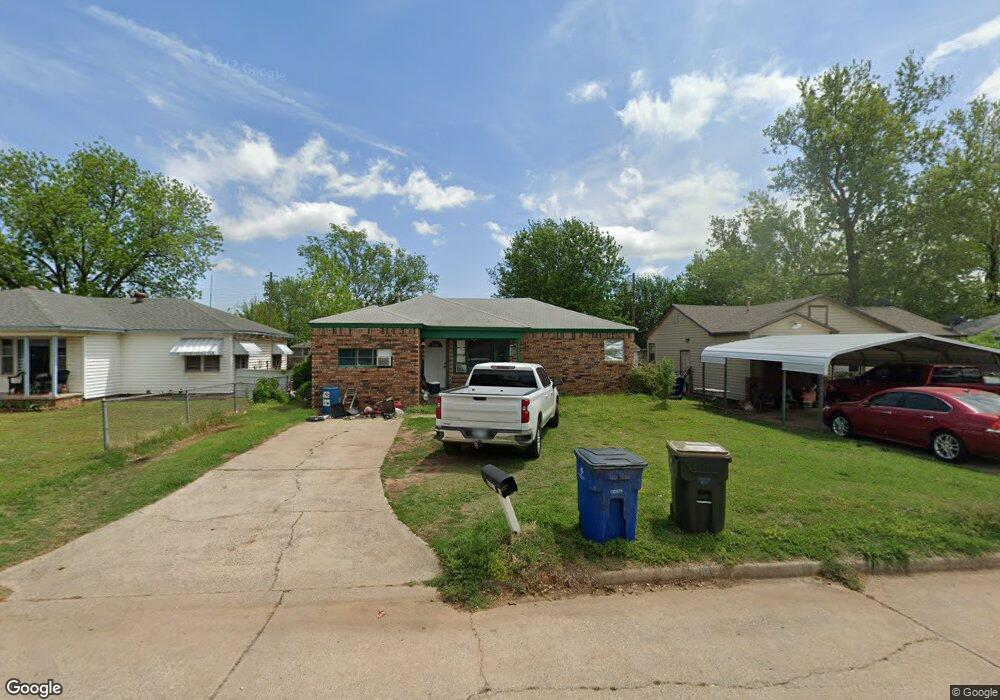
310 N F St Duncan, OK 73533
Estimated Value: $59,000 - $80,000
3
Beds
1
Bath
1,406
Sq Ft
$50/Sq Ft
Est. Value
About This Home
This home is located at 310 N F St, Duncan, OK 73533 and is currently estimated at $70,718, approximately $50 per square foot. 310 N F St is a home located in Stephens County with nearby schools including Woodrow Wilson Elementary School, Duncan Middle School, and Duncan High School.
Ownership History
Date
Name
Owned For
Owner Type
Purchase Details
Closed on
May 3, 2013
Sold by
Morgan David R and Morgan Lara K
Bought by
Morgan Properties Llc Series Two
Current Estimated Value
Purchase Details
Closed on
Sep 7, 2005
Sold by
Morgan Vici Beth and Morgan Billy
Bought by
Morgan David R and Morgan Lara K
Home Financials for this Owner
Home Financials are based on the most recent Mortgage that was taken out on this home.
Original Mortgage
$28,350
Outstanding Balance
$15,007
Interest Rate
5.78%
Mortgage Type
New Conventional
Estimated Equity
$55,711
Create a Home Valuation Report for This Property
The Home Valuation Report is an in-depth analysis detailing your home's value as well as a comparison with similar homes in the area
Home Values in the Area
Average Home Value in this Area
Purchase History
| Date | Buyer | Sale Price | Title Company |
|---|---|---|---|
| Morgan Properties Llc Series Two | -- | None Available | |
| Morgan David R | $31,500 | Stewart Escrow & Title |
Source: Public Records
Mortgage History
| Date | Status | Borrower | Loan Amount |
|---|---|---|---|
| Open | Morgan David R | $28,350 |
Source: Public Records
Tax History Compared to Growth
Tax History
| Year | Tax Paid | Tax Assessment Tax Assessment Total Assessment is a certain percentage of the fair market value that is determined by local assessors to be the total taxable value of land and additions on the property. | Land | Improvement |
|---|---|---|---|---|
| 2025 | $479 | $5,907 | $344 | $5,563 |
| 2024 | $479 | $5,626 | $344 | $5,282 |
| 2023 | $479 | $5,358 | $344 | $5,014 |
| 2022 | $471 | $5,534 | $344 | $5,190 |
| 2021 | $478 | $5,618 | $344 | $5,274 |
| 2020 | $440 | $5,096 | $344 | $4,752 |
| 2019 | $420 | $4,853 | $344 | $4,509 |
| 2018 | $412 | $4,622 | $344 | $4,278 |
| 2017 | $411 | $4,871 | $344 | $4,527 |
| 2016 | $387 | $4,552 | $293 | $4,259 |
| 2015 | $328 | $4,335 | $289 | $4,046 |
| 2014 | $328 | $4,129 | $286 | $3,843 |
Source: Public Records
Map
Nearby Homes