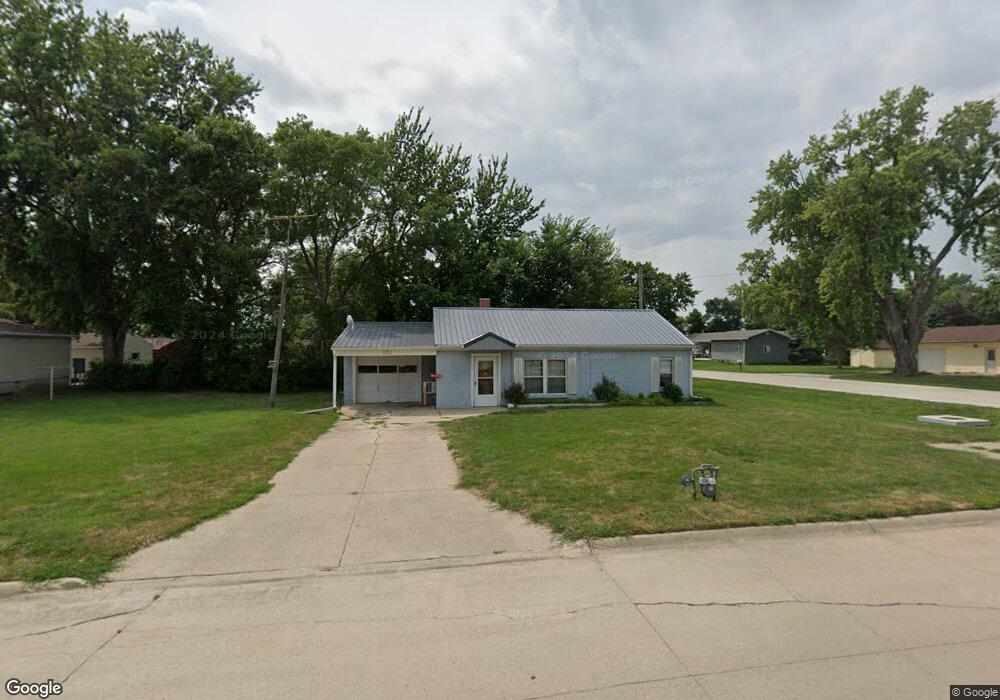
310 N Main St Osmond, NE 68765
Estimated Value: $61,598 - $169,000
2
Beds
1
Bath
864
Sq Ft
$130/Sq Ft
Est. Value
About This Home
This home is located at 310 N Main St, Osmond, NE 68765 and is currently estimated at $112,150, approximately $129 per square foot. 310 N Main St is a home located in Pierce County with nearby schools including Osmond Elementary School, Osmond High School, and St Mary's School.
Ownership History
Date
Name
Owned For
Owner Type
Purchase Details
Closed on
Dec 2, 2024
Sold by
Kuehler Eric and Kuehler Nichole
Bought by
Kuehler Properties Llc
Current Estimated Value
Purchase Details
Closed on
Sep 17, 2019
Sold by
Ramirez Mayra Soto
Bought by
Kuehler Eric
Home Financials for this Owner
Home Financials are based on the most recent Mortgage that was taken out on this home.
Original Mortgage
$24,950
Interest Rate
3.6%
Mortgage Type
Commercial
Purchase Details
Closed on
Jan 17, 2018
Sold by
Broekemeier Sharon
Bought by
Ramirez Mayra Soto
Purchase Details
Closed on
Sep 20, 2017
Sold by
Bettencourt Harriet
Bought by
Broekmeier Sharon
Create a Home Valuation Report for This Property
The Home Valuation Report is an in-depth analysis detailing your home's value as well as a comparison with similar homes in the area
Home Values in the Area
Average Home Value in this Area
Purchase History
| Date | Buyer | Sale Price | Title Company |
|---|---|---|---|
| Kuehler Properties Llc | -- | None Listed On Document | |
| Kuehler Eric | $19,000 | Chilvers Abstract & Title Co | |
| Ramirez Mayra Soto | $18,000 | None Available | |
| Broekmeier Sharon | $23,000 | None Available |
Source: Public Records
Mortgage History
| Date | Status | Borrower | Loan Amount |
|---|---|---|---|
| Previous Owner | Kuehler Eric | $24,950 |
Source: Public Records
Tax History Compared to Growth
Tax History
| Year | Tax Paid | Tax Assessment Tax Assessment Total Assessment is a certain percentage of the fair market value that is determined by local assessors to be the total taxable value of land and additions on the property. | Land | Improvement |
|---|---|---|---|---|
| 2025 | $381 | $29,250 | $9,375 | $19,875 |
| 2024 | $381 | $29,250 | $9,375 | $19,875 |
| 2023 | $402 | $23,625 | $3,750 | $19,875 |
| 2022 | $434 | $23,625 | $3,750 | $19,875 |
| 2021 | $400 | $21,710 | $3,750 | $17,960 |
| 2020 | $461 | $24,950 | $3,750 | $21,200 |
| 2019 | $436 | $24,950 | $3,750 | $21,200 |
| 2018 | $407 | $23,950 | $3,750 | $20,200 |
| 2017 | $390 | $22,995 | $3,750 | $19,245 |
| 2016 | $375 | $22,995 | $3,750 | $19,245 |
| 2015 | $375 | $22,995 | $3,750 | $19,245 |
| 2014 | $470 | $26,260 | $3,750 | $22,510 |
Source: Public Records
Map
Nearby Homes
- 304 W 2nd St
- 301 N Logan St
- 510 N State St
- 610 N Maple St
- 708 N Maple St
- 542 Nebraska 13
- 553 Ave 867th
- 857th Rd 548th Ave
- 854th Rd 551st Ave
- 208 N 9th St
- 403 N 3rd St
- 802 S Bismark St
- 409 N Elm St
- 301 E Roosevelt St
- 106 N West St
- 104 N West St
- 108 N Plum St
- 702 E Norris St
- 703 E Clark St
- 4.5 Acres 552nd Ave