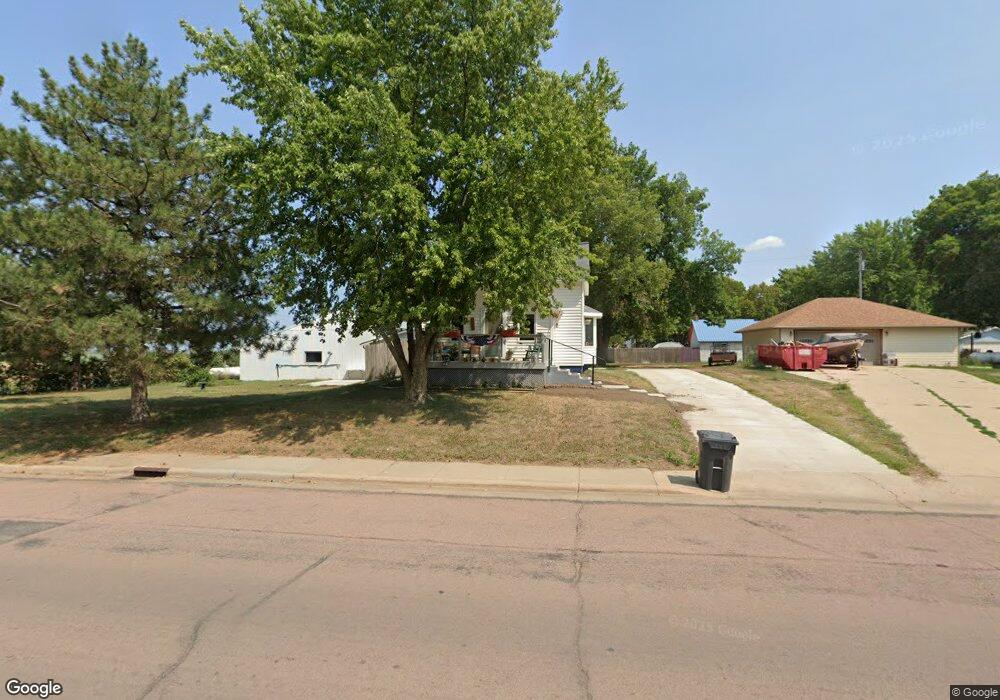
310 N Main St Viborg, SD 57070
Estimated Value: $156,000 - $196,105
4
Beds
1
Bath
1,136
Sq Ft
$160/Sq Ft
Est. Value
About This Home
This home is located at 310 N Main St, Viborg, SD 57070 and is currently estimated at $182,026, approximately $160 per square foot. 310 N Main St is a home with nearby schools including Viborg-Hurley Elementary School, Cameron Colony Elementary School, and Viborg-Hurley Middle School.
Ownership History
Date
Name
Owned For
Owner Type
Purchase Details
Closed on
Jun 25, 2007
Sold by
Jensen David and Jensen Kimberly
Bought by
Cramer Dean
Current Estimated Value
Home Financials for this Owner
Home Financials are based on the most recent Mortgage that was taken out on this home.
Original Mortgage
$78,000
Outstanding Balance
$47,754
Interest Rate
6.2%
Estimated Equity
$134,272
Create a Home Valuation Report for This Property
The Home Valuation Report is an in-depth analysis detailing your home's value as well as a comparison with similar homes in the area
Purchase History
| Date | Buyer | Sale Price | Title Company |
|---|---|---|---|
| Cramer Dean | -- | -- |
Source: Public Records
Mortgage History
| Date | Status | Borrower | Loan Amount |
|---|---|---|---|
| Open | Cramer Dean | $78,000 |
Source: Public Records
Tax History
| Year | Tax Paid | Tax Assessment Tax Assessment Total Assessment is a certain percentage of the fair market value that is determined by local assessors to be the total taxable value of land and additions on the property. | Land | Improvement |
|---|---|---|---|---|
| 2025 | $1,969 | $122,959 | $18,820 | $104,139 |
| 2024 | $1,898 | $122,959 | $18,820 | $104,139 |
| 2023 | $1,607 | $122,959 | $18,820 | $104,139 |
| 2022 | $1,572 | $107,859 | $16,509 | $91,350 |
| 2021 | $1,563 | $92,929 | $12,699 | $80,230 |
| 2020 | $1,491 | $92,929 | $12,699 | $80,230 |
| 2019 | $1,472 | $85,255 | $11,650 | $73,605 |
| 2018 | $1,375 | $82,770 | $11,310 | $71,460 |
| 2017 | $1,257 | $72,120 | $5,050 | $67,070 |
| 2016 | $1,115 | $62,710 | $4,390 | $58,320 |
| 2015 | $1,115 | $50,225 | $3,660 | $46,565 |
| 2012 | -- | $69,755 | $5,085 | $64,670 |
Source: Public Records
Map
Nearby Homes
- 306 N Main St
- 0 N Elmwood St Unit 22507122
- 202 N Kemper St
- 105 N Nora St
- 0 Lot 10 Block 2 Valhalla Dr Dr
- 0 Lot 10 Block 4 Viking Ave Ave Unit 22600393
- 0 Lot 1a Block 3 Viking Ave Ave Unit 22600396
- 208 S Clark St
- 210 S Clark
- 210 Clark St
- 0 Tbd Industrial Tr 19 St St Unit 22601215
- 0 Tbd Dakota Tr 7 Ave Ave Unit 22601212
- 0 Tbd Dakota Tr 8 Ave Ave Unit 22601214
- 0 Tbd Jorgensen Tr 11 St St Unit 22601210
- 0 Tbd Jorgensen Tr 13 St St Unit 22601207
- 0 290th St Unit 22201045
- 0 455th Ave
- 101 Lakeview Dr
- 100 Bright Shores Dr Dr
- 452nd Avenue
Your Personal Tour Guide
Ask me questions while you tour the home.